
- This topic has 28,062 replies, 54 voices, and was last updated 5 hours, 26 minutes ago by GVI Forex 2.
-
AuthorPosts
-
May 13, 2024 at 5:47 pm #6181May 13, 2024 at 5:21 pm #6180
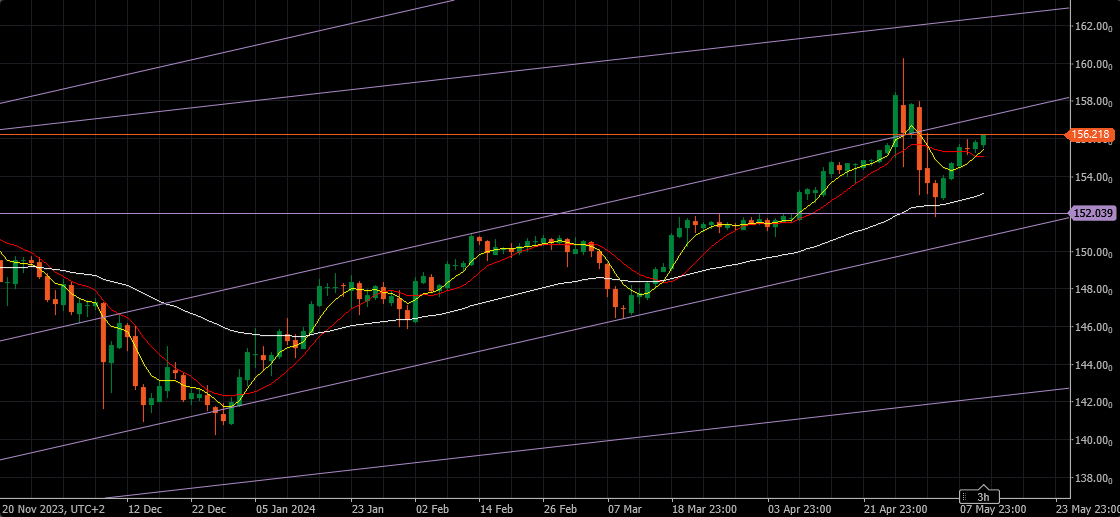
USDJPY Daily
Resistance at 157.100
Support 155.750 & 155.950
If we forget about BoJ , this pair is moving Up – it is in Buy mode on the daily.
If you have to play with this pair right now, go with very tight stops, but be aware that in the case BoJ reacts again, they might be executed way lower – so use your margin wisely and go very light to counter that slippage risk.
 May 13, 2024 at 5:10 pm #6179
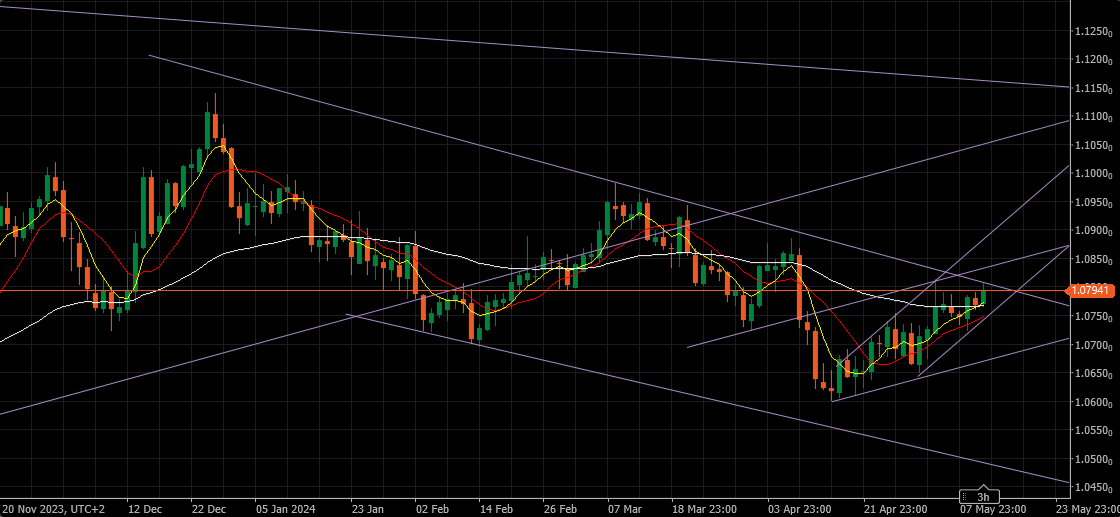
EURUSD Daily
Resistance 1.08050 & 1.08350
Support 1.07750 & 1.07500
As you can see from the chart, it was rejected at downtrend line 1.08050.
For the continuation of Uptrend, I would like to see support at 1.07750 holding it’s ground (smaller time frames indicate a test of it )
We have lots of Data tomorrow and some very important ones at that!
The current Pattern on Daily can go both ways – so wait for Data .
 May 13, 2024 at 4:52 pm #6178May 13, 2024 at 4:39 pm #6176May 13, 2024 at 4:36 pm #6173May 13, 2024 at 4:34 pm #6172May 13, 2024 at 3:58 pm #6171
USDJPY 4 HOUR CHART
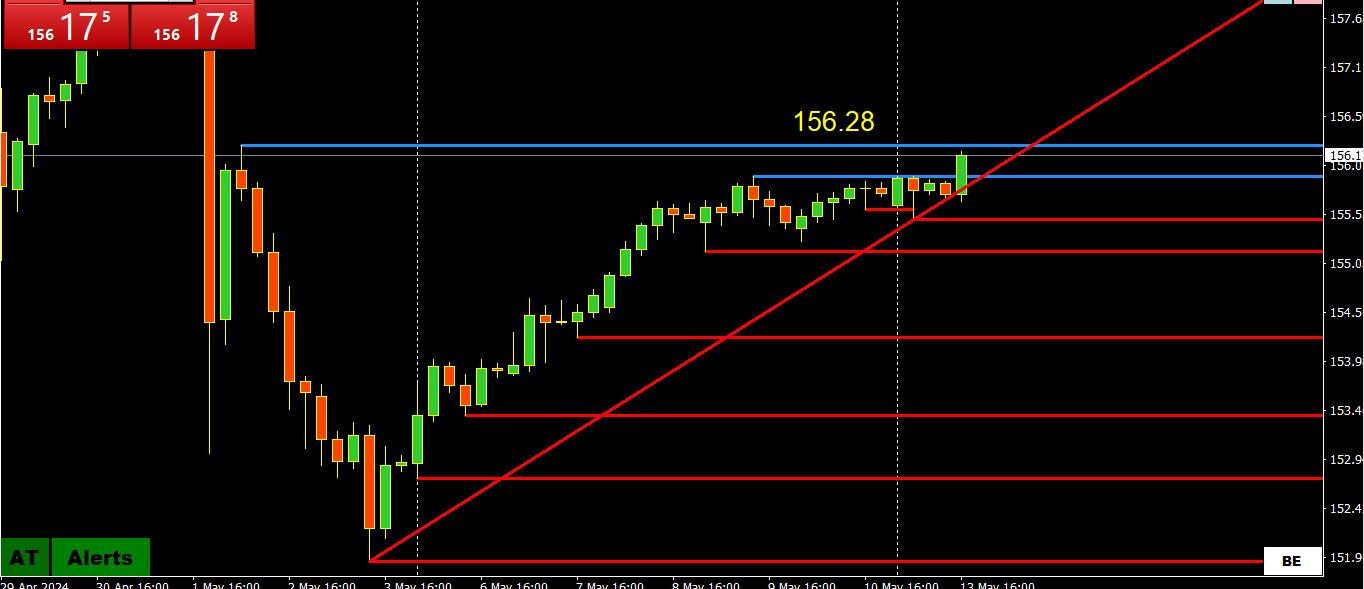
USDJPY spikes higher following a tick up in us yields (only a little) following the Fed’s inflation expectations survey.
If you scroll through THE FORUM PAGES YOU WILL SEE MY WEEKEND UPDATE WHERE I NOTED IT MAY DEPEND ON WHAT CHARTS THE BOJ is looking at.
ON THE 4 HOUR, 156.28 IS A LEVEL IT WOULD NOT WANT TO SEE TRADE.
THE IMPORTANT LEVEL IS 157.98 ON ALL TIME FRAMES.
Note, EURJPY came within a few pips of the key 168.65 resistance cited earlier (scroll down the forum)
May 13, 2024 at 3:24 pm #6170May 13, 2024 at 3:22 pm #6169May 13, 2024 at 3:21 pm #6168copy paste from NY FED
how bad is jerome the inflation fighter screwed ?
–
PRESS RELEASE
Consumers Expect Higher Short-Term Inflation and Home Price Growth
May 13, 2024
NEW YORK—The Federal Reserve Bank of New York’s Center for Microeconomic Data today released the April 2024 Survey of Consumer Expectations, which shows that inflation expectations increased at the short-term and longer-term horizons, while decreasing at the medium-term horizon. Home price growth expectations reached the highest level since July 2022. Spending growth expectations also increased. The average perceived likelihood of voluntary and involuntary job separation declined, as did the perceived likelihood of finding a job in the event of a job loss.The main findings from the April 2024 Survey are:
Inflation
Median inflation expectations increased to 3.3% from 3.0% at the one-year horizon (remaining below its 12-month trailing average of 3.5%), decreased to 2.8% from 2.9% at the three-year horizon, and increased to 2.8% from 2.6% at the five-year horizon. The survey’s measure of disagreement across respondents (the difference between the 75th and 25th percentile of inflation expectations) decreased at the one-year horizon and increased at the three-year and five-year horizons.
Median inflation uncertainty—or the uncertainty expressed regarding future inflation outcomes—increased at the one- and five-year horizons and declined at the three-year horizon.
Median home price growth expectations increased to 3.3% after remaining unchanged at 3.0% for seven consecutive months. This is the highest reading of the series since July 2022. The increase was most pronounced for respondents with a high school degree or less.
Year-ahead commodity price expectations rose across the board in April, increasing by 0.3 percentage point for gas to 4.8%, 0.2 percent point for food to 5.3%, 0.6 percent point for the cost of medical care to 8.7%, 2.5 percentage points for the cost of college education to 9.0% and 0.4 percentage point for rent to 9.1%.May 13, 2024 at 3:06 pm #6167May 13, 2024 at 3:05 pm #6166May 13, 2024 at 3:02 pm #6165May 13, 2024 at 2:26 pm #6159Players are, imo, not going to go “all hog” with bets. It looks like market is expecting “sticky” inflation. And the expectation for the pace of inflation is that IT will slow down some. So that is where the core bet is.
lets how market sees and prices things at top of hour with release of
11:00 – NY fed’s 1-yr inflation expectation (vs 3% last)May 13, 2024 at 2:16 pm #6158May 13, 2024 at 1:50 pm #6157AUDUSD 4 HOUR CHART – TESTING RESISTANCE

As I noted yesterday (scroll to prior pages for a broader view) .6600 would likely set its tone.
This has seen a test of .6624 resistance, its significance is that it guards the key .6648 level as seen on this chart.
Supports and trendline are below .6600, so keep the focus on this level to set the trading bias.
May 13, 2024 at 12:51 pm #6156May 13, 2024 at 12:45 pm #6155I was just asked to elaborate on the Path of Least resistance. Here is an article that keeps proving to be a timely one.
The forex market is on a constant search for the path of least resistance, whether it be on the up or downside for a currency. A trend starts like the gently flowing stream, picks up momentum as with the cascading water, and then reaches a climax when it hits the waterfall.
Jay Meisler’s Common Sense Trading: How You Can Identify the Path of Least Resistance?
Jay Meisler’s Common Sense Trading: How You Can Identify the Path of Least Resistance?
May 13, 2024 at 12:25 pm #6154EURJPY 4 HOUR CHART – PROBING THE PATH OF LEAST RESISTANCE

With the BoJ intervention threat looming, the market is following the path of least resistance by selling JPY on its crosses.
This has seen EURUSD creep higher while USDJPY is barely moving.
The chart shows the key resistance levels (168.65 and 171.58) while support starts at the up trendline.May 13, 2024 at 12:08 pm #6153May 13, 2024 at 11:13 am #6150I was sent this macro view by a seasoned trader
Unless you have to do something there’s nothing that would draw someone into taking on any risk in fx right now. Maybe stays this way til after US elections with no one willing to commit to usd strength or weakness…..
JPY risk probably not worth it from both sides.
The EUR or other dollar plays are worse than data dependent because its more what market wants then what it gets. Movement overall has been trendless with micro moves the equivalent of static. Safe plays like chf weakness are still on the table but the initial leg is played out.
May 13, 2024 at 10:55 am #6149MARKETS REMAIN HYPER-SENSTIVE TO ECONOMIC DATA RELEASES SO HOLD ON TO YOUR SEAT BELTS NEXT WEEK WHEN US RETAIL SALES AND CPI WILL BE REPORTED… SEE DETAILED PREVIEWS IN THIS VERY POPULAR WEEK-AHEAD REPORT
 May 13, 2024 at 10:42 am #6145
A look at the day ahead in U.S. and global markets from Mike Dolan
Wall Street and world stock markets have cleared the first-quarter corporate earnings season comfortably enough to be back stalking record highs, but macro markets don’t want to budge much further until they see this week’s U.S. inflation update.
Wednesday’s U.S. consumer price report sucks much of the oxygen out of the early part of the markets week – critical as it is in revealing whether disinflation has resumed after a sticky Q1, and at least enough to keep Federal Reserve easing expectations this year in the frame.
May 13, 2024 at 10:42 am #6144A look at the day ahead in U.S. and global markets from Mike Dolan
Wall Street and world stock markets have cleared the first-quarter corporate earnings season comfortably enough to be back stalking record highs, but macro markets don’t want to budge much further until they see this week’s U.S. inflation update.
Wednesday’s U.S. consumer price report sucks much of the oxygen out of the early part of the markets week – critical as it is in revealing whether disinflation has resumed after a sticky Q1, and at least enough to keep Federal Reserve easing expectations this year in the frame.
May 13, 2024 at 10:31 am #6140May 13, 2024 at 10:26 am #6139This week will determine theme for the rest of 2024
10-yr 4.485% 6:08 am
After 11 rate hikes hero powell – who has been wrong for 7 qtrs – keeps feeding players hope for rate cut theme.
Wednesday:
Core Inflation YoY 3.6% vs 3.8%
Inflation Rate YoY 3.4% vs 3.5%IF the release comes in hotter than expected
NO cut at least in rest of 2024Feel free to place your bets
May 13, 2024 at 10:02 am #6138May 13, 2024 at 9:28 am #6137USDX DAILY CHART – PROXY FOR EURUSD
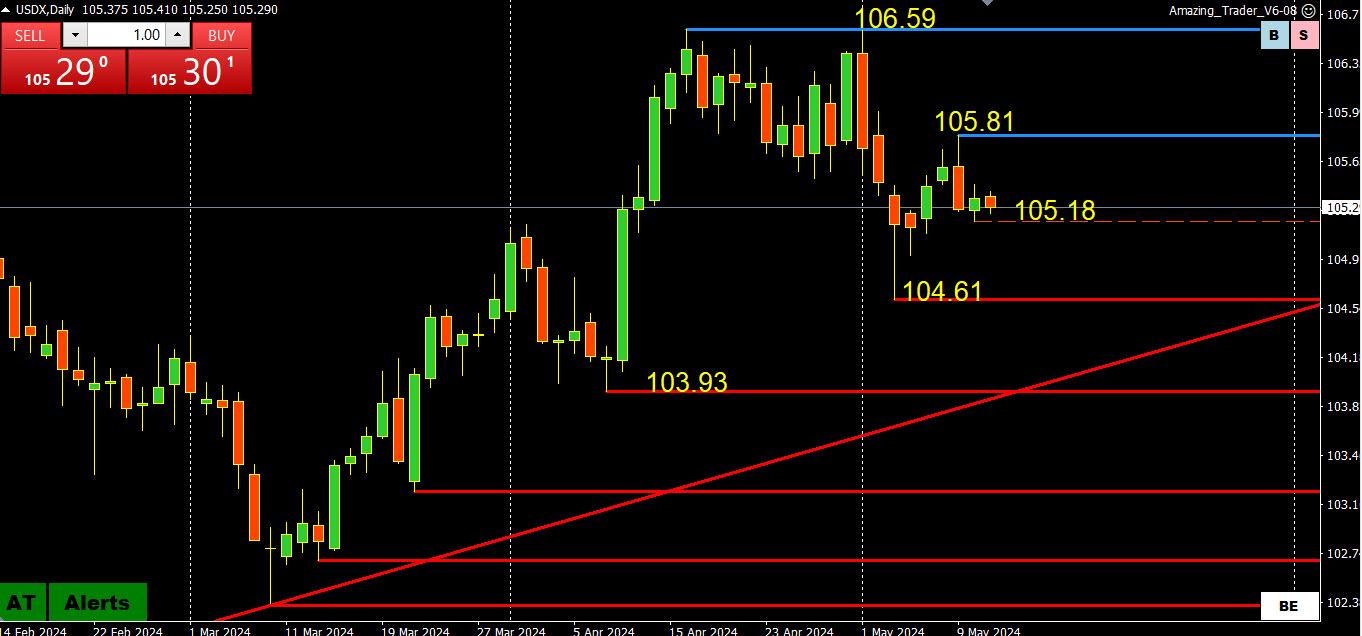
As I have said before, I look at the USDX not for trading it but as a proxy for EURUSD as it represents 57.6% of the index.
The key level on the downside is at 104.61 as a break would be needed to turn this into a downtrend.
Otherwise, the market is in a holding pattern awaiting US data later this week.
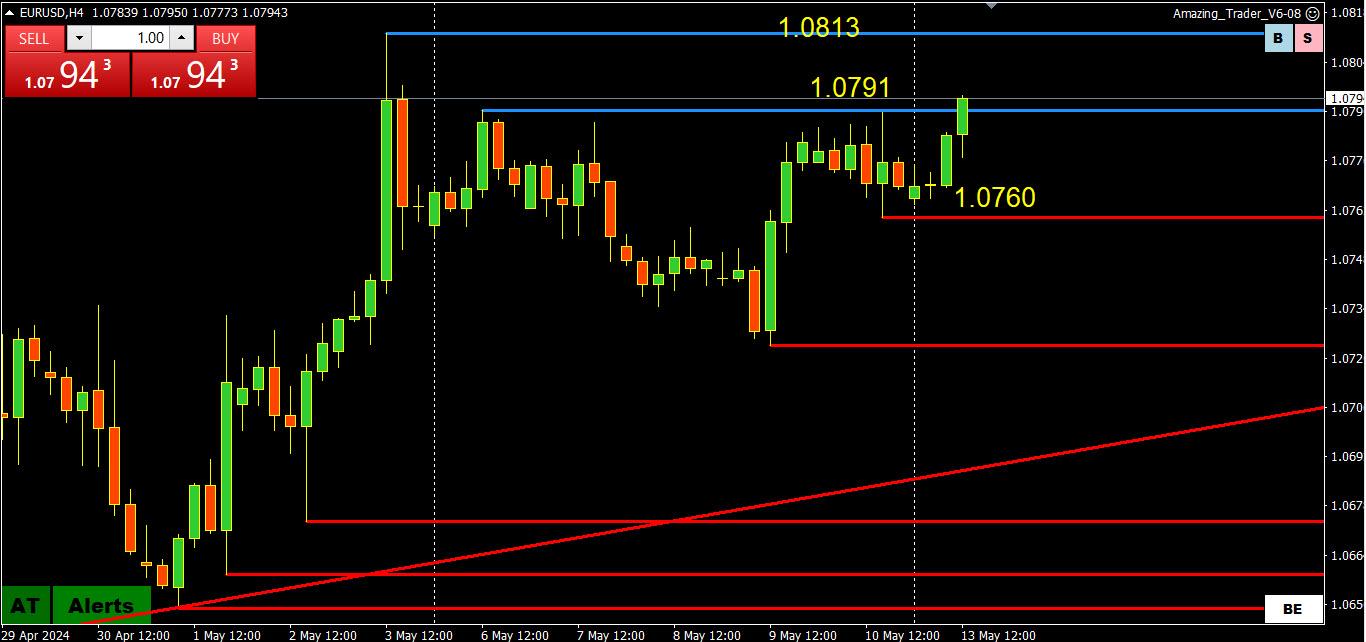
Note for EURUSD, there remains a double top at 1.0791 blocking 1.0800 (psychological) and key 1.0813
High so far today 1.08895
May 13, 2024 at 8:51 am #6136 -
AuthorPosts
- You must be logged in to reply to this topic.
Search
© 2024 Global View