
- This topic has 28,042 replies, 54 voices, and was last updated 14 minutes ago by GVI Forex 2.
-
AuthorPosts
-
May 25, 2024 at 11:14 am #6841
Trade like a pro
How can you make sure you trade like the professionals? One of the best ways is to make sure you treat your trading like a business. You need to be sure that when you are trading you are trading; it is not for fun or speculation, but to make money.
We have some tips and ideas to help you make that a reality.
Trade like a Pro – 8-STEP CHECKLIST TO DETERMINE IF YOU’RE TREATING TRADING LIKE A BUSINESS

Trade like a Pro – 8 STEP CHECKLIST TO DETERMINE IF YOU’RE TREATING TRADING LIKE A BUSINESS
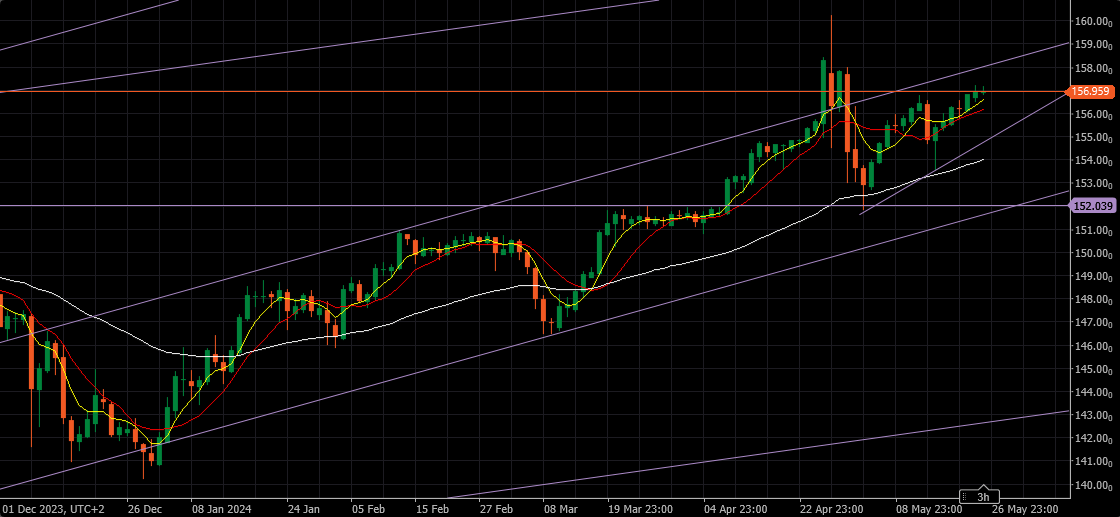
May 25, 2024 at 9:08 am #6839USDJPY WEEKLY CHART – UPTREND SINCE THE START OF 2023
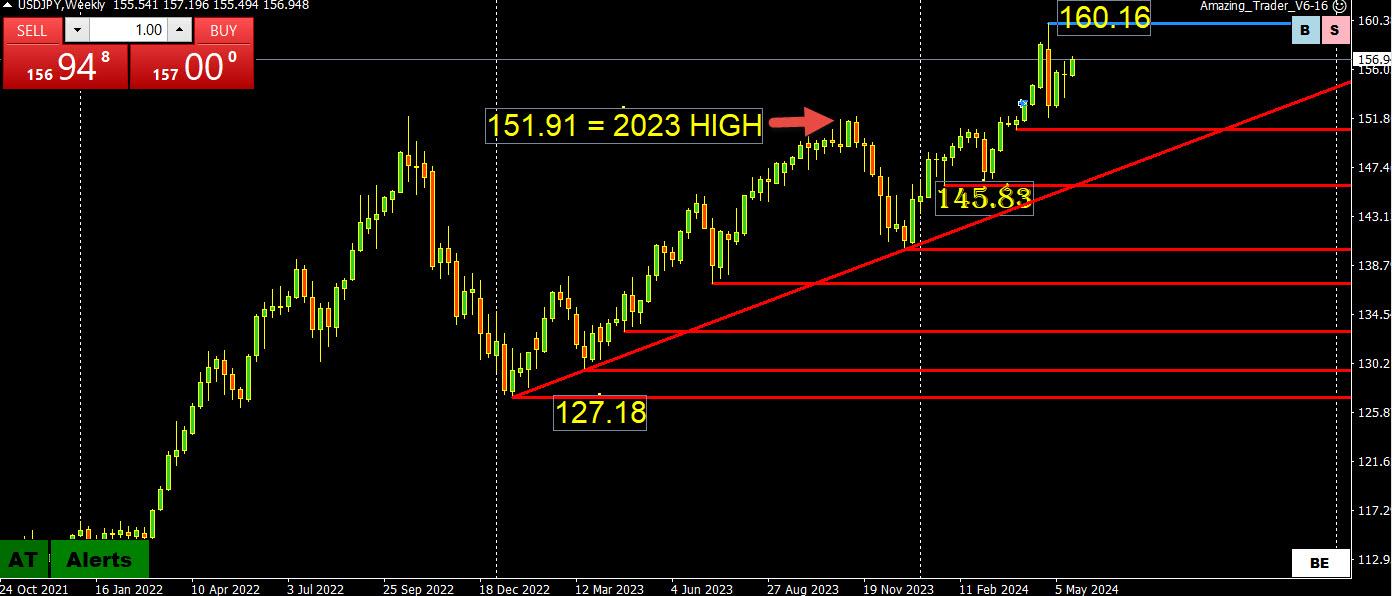
USDJPY has been in a weekly uptrend since the start of 2023, which elevates the importance of its weekly trendline. There is already a 10% range from the low to the high this yeasr
Where is the risk?
While the techincal risk is still pointed up (note the trendline), the volatility risk is if the currency reverses to the downside. However, betting on intervention or other policy moves to reverse the trend is expensive given the cost of a rollover being long JPY, pitting those trading on hope vs. those trading on fundamentals.
To keep it simple,
152.92 = 50% of this year’s range and 151.91 is last year’s high.
To make it even simpler, USDJPY trades with support as long as it stays above 155 and only sub-150 trade would suggest the high is in.
On the upside, levels are clear
158.00 and 160.16
This suggests 158-160 would be the intervention alert zone.
I haven’t mentioned JPY crosses, where there is less chance of intervention.
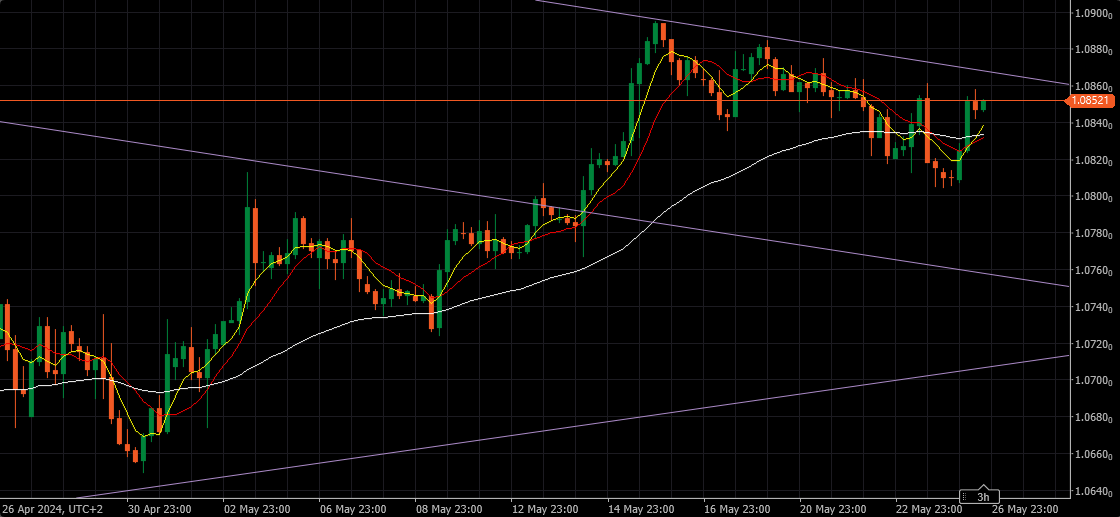
May 25, 2024 at 8:49 am #6838EURUSD WEEKLY CHART – INSIDE YEAR
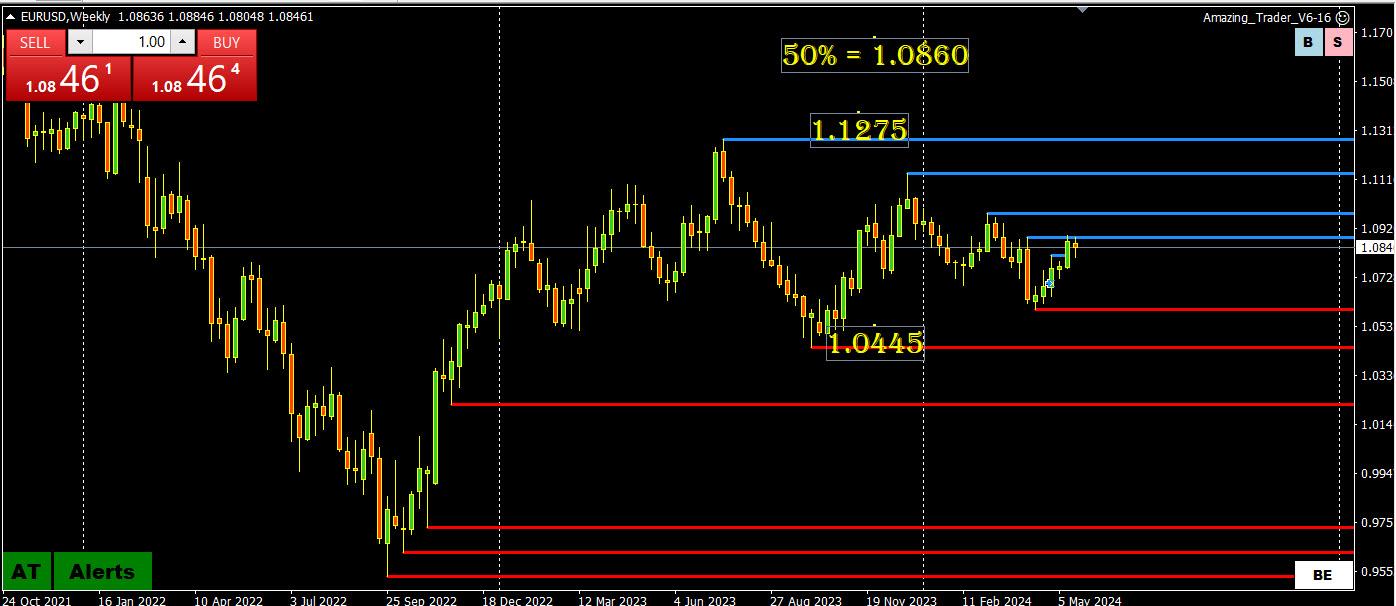
I remember when central banks used to look at 10 big figure ranges, such as EURUSD 1.00-1.10, 1.05-1.15. 1.10-1.20
Looking at this weekly chart not only is the range less than 10 big figures but is also so far an inside year.
Taking it one step further, 50% of the 2023 range is 1.0860 vs Friday’s close around 1.0845
Compare that with USDJPY and you can see why the EURUSD has been better suited for short-term trends rather than betting on longer-term trends and breakouts.
This does not mean it will not trade like this forever but at least it puts the price action in perspective.
So without fine-tuning, you can either use 1.0860 (I prefer 1.0850, which is close enough) to set its tone for day trading while within 1.08-1.09, a range too tight to last,.
May 24, 2024 at 10:18 pm #6837Fed’s preferred inflation indicator (PCE) will likely show that disinflation stalled in April
Eurozone inflation is forecast to have increased in May but the move up is seen as atemporary.
 May 24, 2024 at 6:22 pm #6836May 24, 2024 at 6:11 pm #6835May 24, 2024 at 6:11 pm #6834May 24, 2024 at 6:10 pm #6833May 24, 2024 at 6:07 pm #6832May 24, 2024 at 5:59 pm #6831May 24, 2024 at 5:50 pm #6830May 24, 2024 at 5:35 pm #6829May 24, 2024 at 4:26 pm #6828
Note to the forum – Monedge is adjusting its focus back toward primarily serving institutional and high net worth individuals.
If you are an individual just like anyone who does not fit those categories but may be interested in acquiring expertise on a more in-depth basis, we are still accepting clients and will maintain service for you but the window is closing to acquire our assistance if you are new. Therefore if you are interested, we suggest giving us a good look and moving fairly soon to sign us up to help you with your trading results (www.monedge.net) if desired.
And of course, Global View is a rock solid resource for a variety of interests and commentary, and we will continue to post here.
Thank you from the team at Monedge.
May 24, 2024 at 4:23 pm #6827May 24, 2024 at 4:16 pm #6826May 24, 2024 at 4:10 pm #6825May 24, 2024 at 3:50 pm #6824May 24, 2024 at 3:29 pm #6823May 24, 2024 at 3:01 pm #6822May 24, 2024 at 3:00 pm #6821May 24, 2024 at 2:51 pm #6819May 24, 2024 at 2:45 pm #6818Dxy is finally catching a little bid. Stock internals are negative even though the indices are showing very slight gains. Therefore not sold on much of a risk appetite environment (which would be long Euro) headed into the weekend. Expecting the 10yr yield to hold 44.50 and perhaps close near it, anything happen. Market is parking money and taking into consideration geopolitical and other uncertainty one might think.
May 24, 2024 at 2:11 pm #6815Given the recent upheaval in the Prop Trading industry and reports of firms closing up, this article will be getting a lot of attention.
15 Questions Traders Should Ask Potential Prop Firm Partners

15 Questions Traders Should Ask Potential Prop Firm Partners
May 24, 2024 at 2:08 pm #6814May 24, 2024 at 2:08 pm #6813May 24, 2024 at 1:42 pm #6812May 24, 2024 at 1:17 pm #6811May 24, 2024 at 1:13 pm #6810May 24, 2024 at 1:12 pm #6809May 24, 2024 at 1:08 pm #6808US500 4 HIUR CHART – BOUNCING BUT..
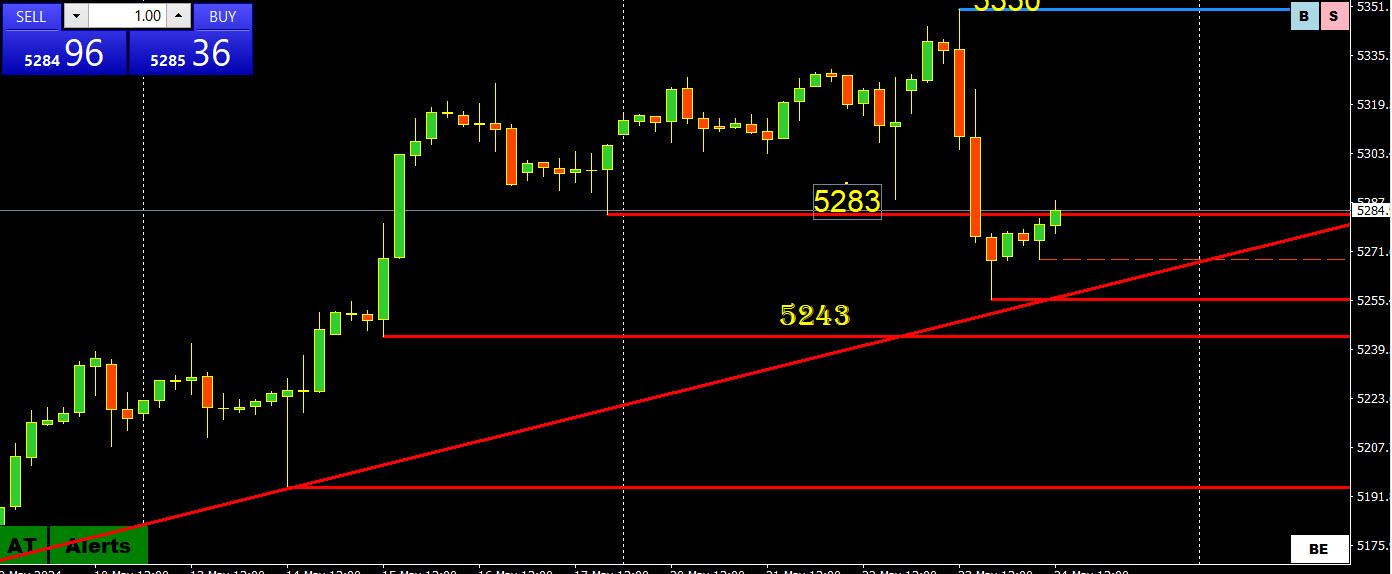
US5– bounce would need to at least recover above 5283 and hold there to ease the risk on the downside.
Keep an eye on US bond yields with the 10-year hovering again just below the pivotal 4.50% level
Note your price s may differ as CFDs prices can vary from broker to broker. Look for a similar pattern or line on your chart.
-
AuthorPosts

- You must be logged in to reply to this topic.
Search
© 2024 Global View