
- This topic has 28,382 replies, 54 voices, and was last updated 46 minutes ago by Adam Global.
-
AuthorPosts
-
July 7, 2024 at 7:05 pm #8684July 7, 2024 at 7:05 pm #8683July 7, 2024 at 6:58 pm #8682
France Election 2024 Live: Left and centre leading far right, pollsters sa
LONDON, July 7 (Reuters) – France was on course for a hung parliament in Sunday’s election, with a leftist alliance unexpectedly taking the top spot ahead of the far right, in a major upset that was set to bar Marine Le Pen’s National Rally from running the government.
Summary
Polls showed the left was leading
Far-right leader Bardella conceded defeat
French voters turned out in large numbers
The counting has begun
Turnout at 5 p.m. was the highest afternoon level since 1981
Here’s our wrapup of the day so farJuly 7, 2024 at 5:08 pm #8673July 7, 2024 at 12:37 pm #8672July 7, 2024 at 12:31 pm #8671July 7, 2024 at 8:52 am #8663EURUSD 1 HOUR CHART – Mind the gap!
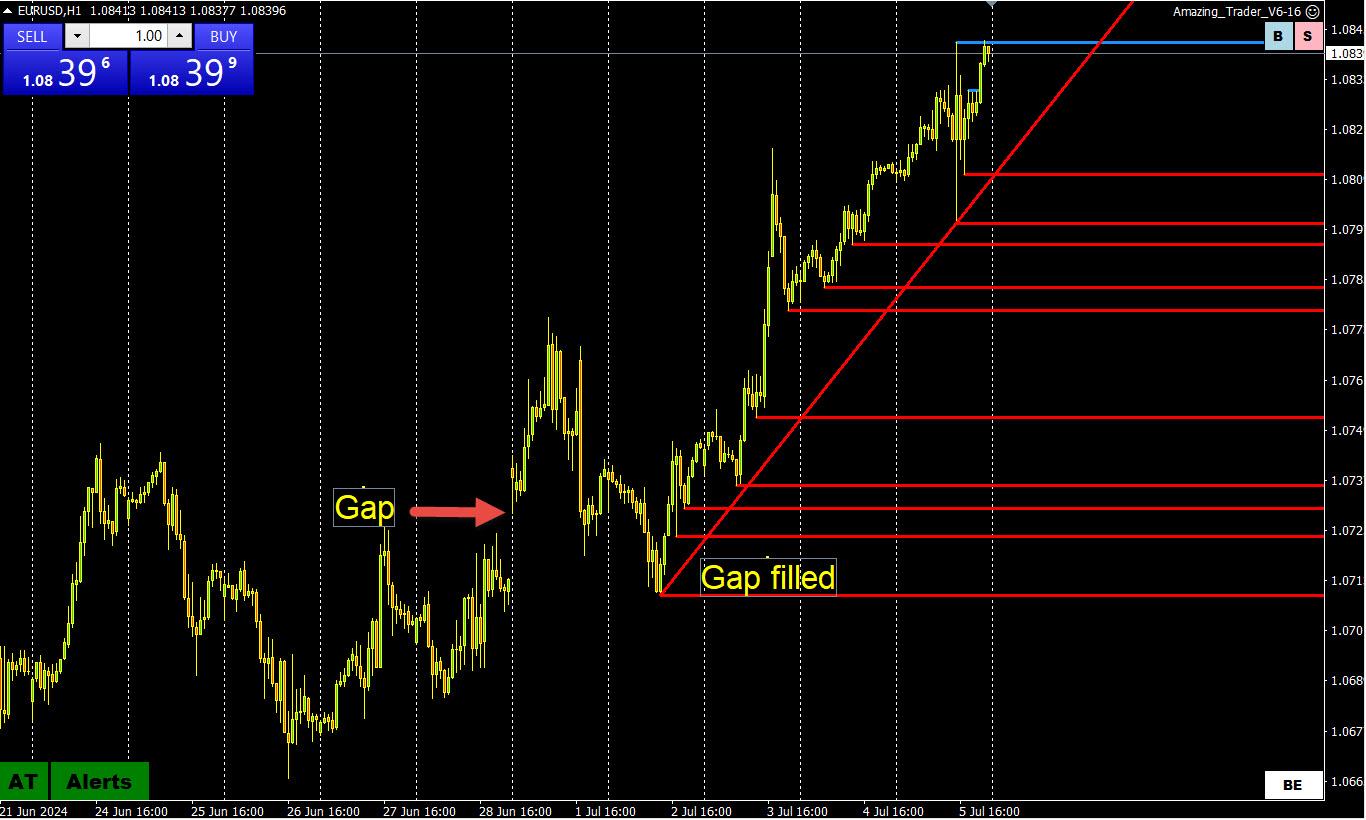
One trigger for the EURUSD rally was that it bounced after filling last week’s opening gap.
Given the French elections and EURUSD closing around its high, there is a risk of another gap opening on the upside.
Scroll down for an update showing key levels on the upside.
July 7, 2024 at 8:47 am #8660July 6, 2024 at 4:44 pm #8644NEW YORK, July 5 (Reuters) – A recalibration of how the U.S. presidential election plays out is causing bond investors to bet yields stay higher for longer as November approaches.
Bond market re-focus on US elections throws wrench into 2024 rally hopefully
July 6, 2024 at 4:28 pm #8643July 6, 2024 at 4:07 pm #8642July 6, 2024 at 3:59 pm #8641July 6, 2024 at 3:55 pm #8640July 6, 2024 at 1:44 pm #8639July 6, 2024 at 1:39 pm #8638Once the dust settles on the French election attention will shift to the U.S. with CPI and Powell testifying/ See the full preview
 July 6, 2024 at 12:09 pm #8635
EYE ON YELLEN
and the UK
–
According to NYT
“Rachel Reeves, Britain’s First Female Chancellor, Turns to Janet Yellen for Inspiration”
Rachel Reeves, who will oversee Britain’s budget, is expected to pursue an agenda influenced by Janet Yellen’s more activist approach to job-creation and investment in the United States.July 6, 2024 at 9:55 am #8634July 6, 2024 at 7:09 am #8633July 6, 2024 at 7:01 am #8632EURUSD DAILY CHART – 1.09-1.10?
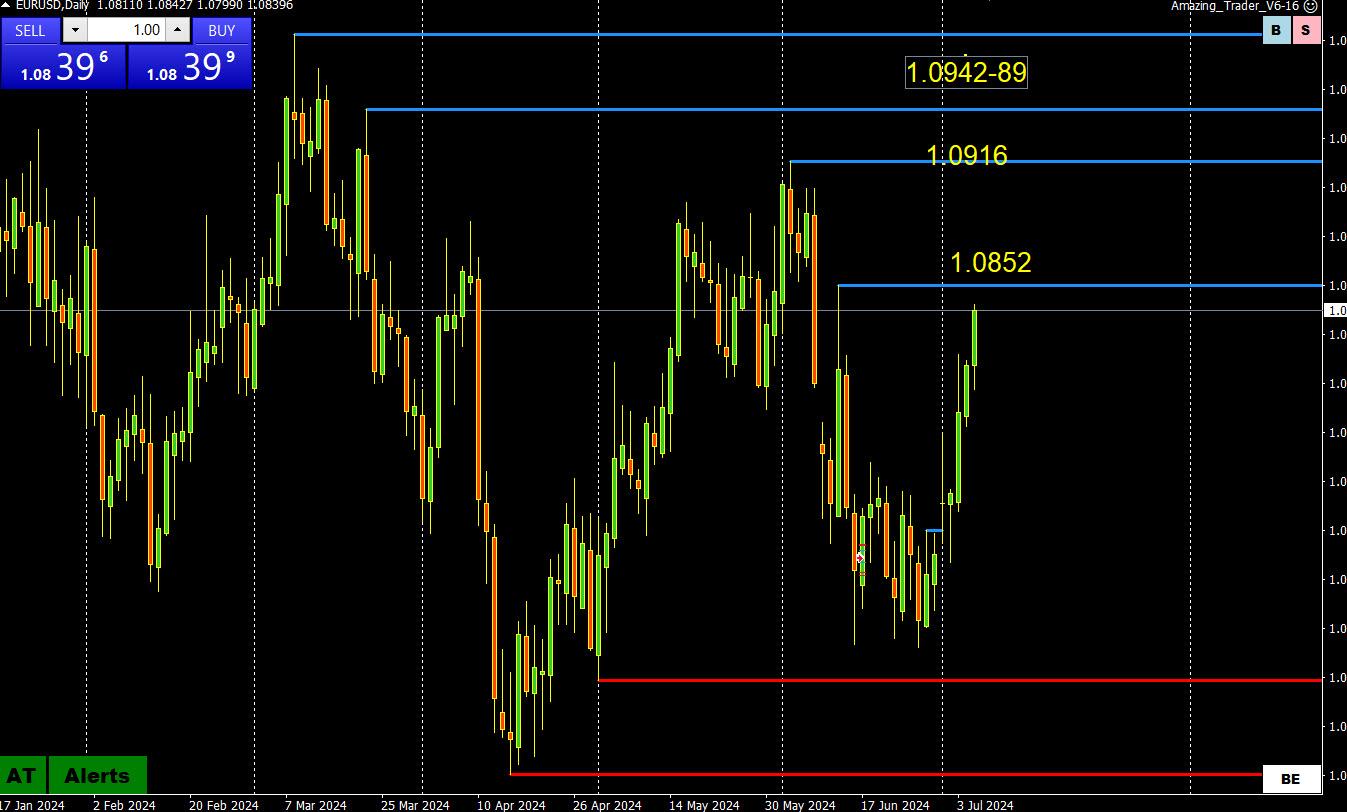
Chart is clear. If 1.0852 is firmly broken and sustained, risk is for a run at targets in the 1.09-10 area.
On the downside, expect support on dips as long as it trades above 1.08.
Note French 2nd round vote is on Sunday and price action suggests a view (and relief) that the far right will not win an outright majority.
July 6, 2024 at 6:25 am #8629USDX WEEKLY CHART – ON THE DEFENIVE
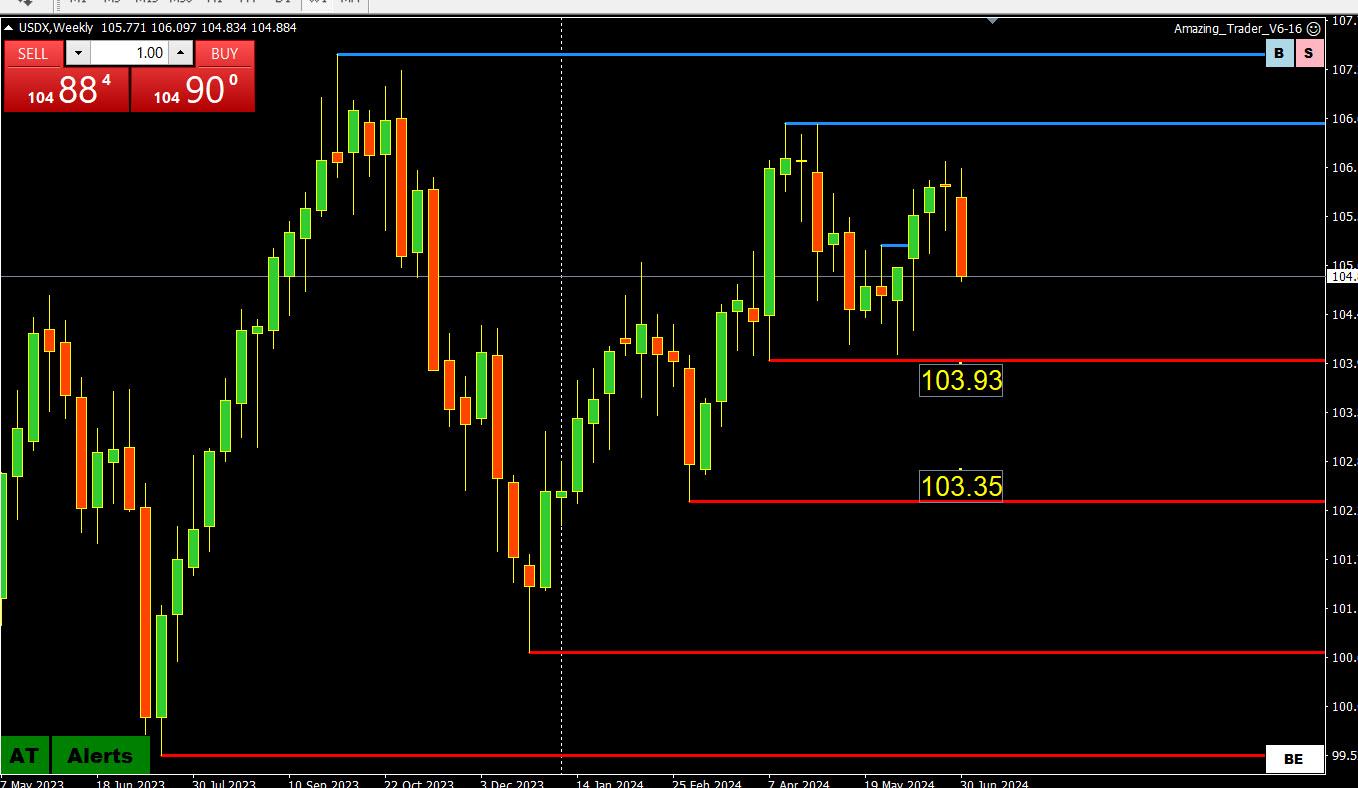
You don’t need a USDX chart to tell you the dollar has turned defensive vs, currencies such as the EURUSD (57.6% of the index) and GBPUSD.
So, it pays to take a look at a USDX weekly chart and what are the targets on the downside. In this regard, the one that stands out is 103.93 (and 103.35 below it), exposed as long as the index trades below 106, greater risk if it stays below 105..
Note USDX is often seen as a proxy for the EURUSD, which makes up 57.6% of the index.
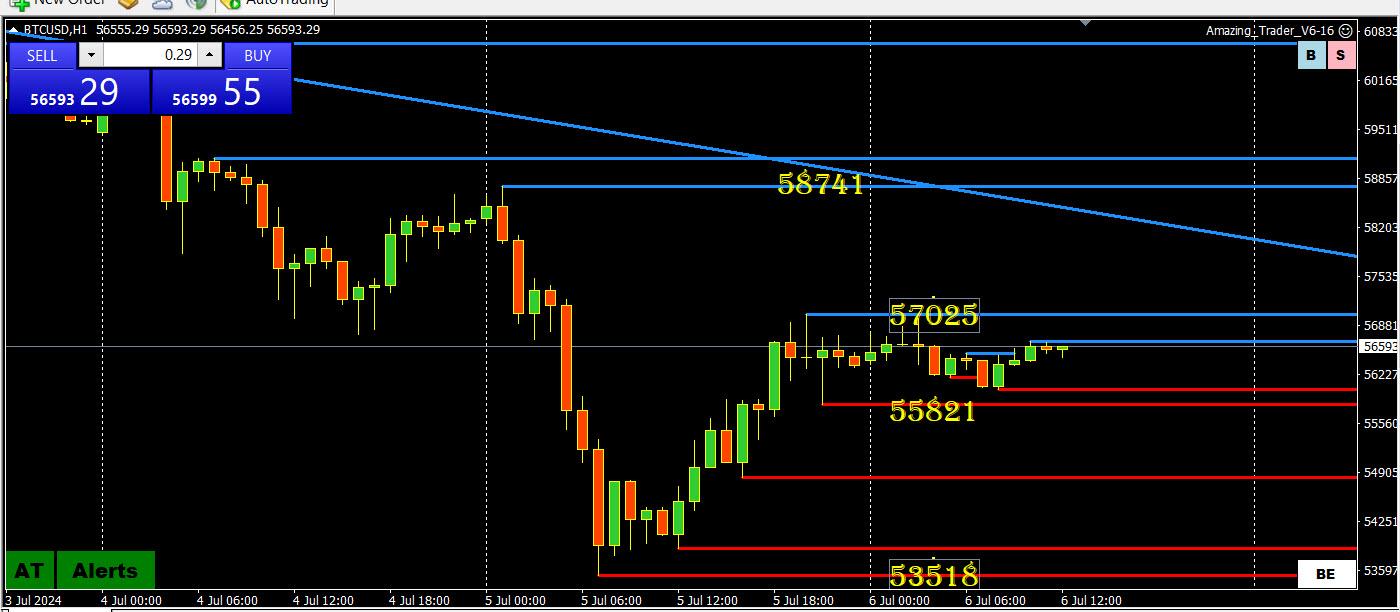
July 5, 2024 at 6:32 pm #8628July 5, 2024 at 5:50 pm #8627July 5, 2024 at 5:46 pm #8626July 5, 2024 at 5:28 pm #8624July 5, 2024 at 4:49 pm #8623I bought Bitcoin at 25k a while back. Really would love to see 35k again, which if I recall accurately Bobby also pointed out as a good area. The range of value I estimated a long time ago is 35k low end and 150k high end with a fair value of 65k. Seems to be going that way. All we need is a few more major blockchain frauds to get us to 35k.
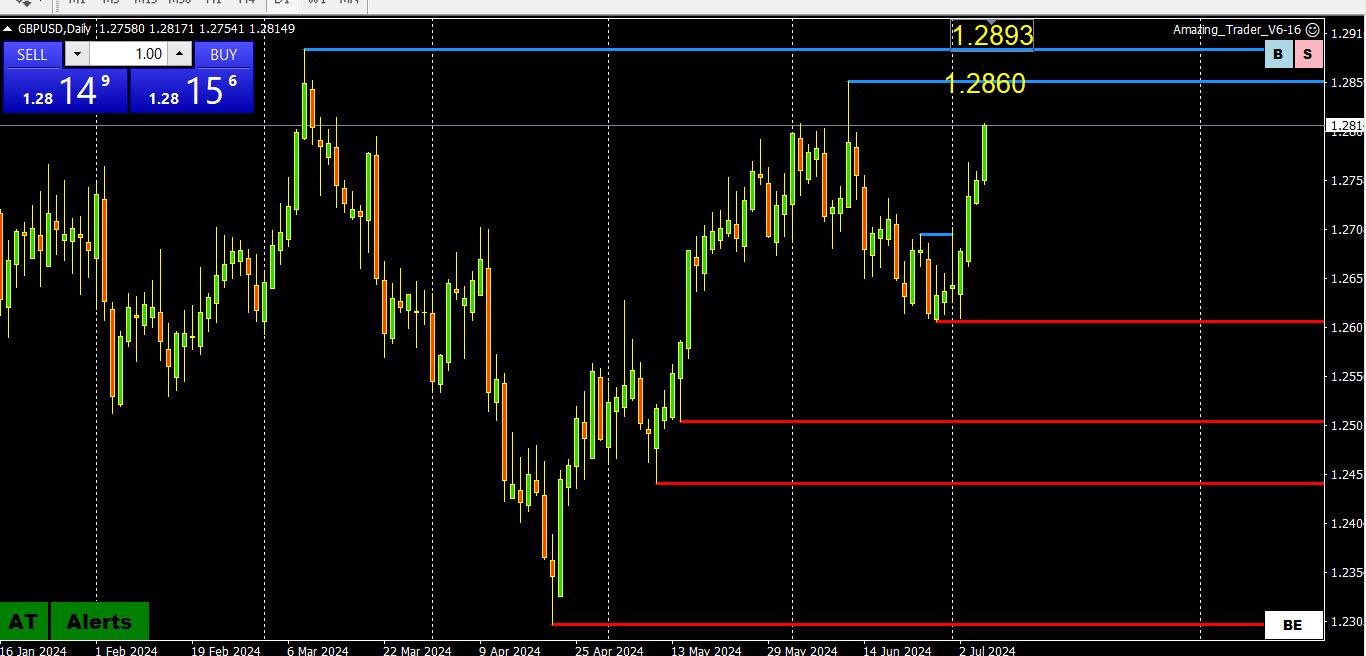
July 5, 2024 at 4:35 pm #8622Sterling covered a 50 point spread (25 each direction) the instant the job numbers came out and was done in less than 2 seconds. Major market entities really only care about longer term positioning. That activity was pre-established with zero regard for the data itself, purely to run stops and collect on the other side of the jolt.
July 5, 2024 at 4:17 pm #8621July 5, 2024 at 3:47 pm #8620July 5, 2024 at 3:31 pm #8619July 5, 2024 at 2:47 pm #8618 -
AuthorPosts

- You must be logged in to reply to this topic.
Search
© 2024 Global View