
- This topic has 28,558 replies, 54 voices, and was last updated 6 hours, 22 minutes ago by GVI Forex 2.
-
AuthorPosts
-
March 18, 2025 at 1:40 pm #21069March 18, 2025 at 1:11 pm #21062March 18, 2025 at 12:57 pm #21061March 18, 2025 at 12:45 pm #21060March 18, 2025 at 12:31 pm #21059March 18, 2025 at 12:27 pm #21058March 18, 2025 at 12:23 pm #21057
…” 500-billion-euro fund for infrastructure”…
–
the traditionally getting-into-debt german is suddenly markets’ darling for sticking its nations neck into a 500-billion euro over next few years debt noose, by some enthusiasts’ calculations to be ballpark 3-4% of GDP.ieeha, economics and peace prize for president trump goading the german thusly ?
euro 1.0918 as I type, on the longer time frame euro still in strong up trend shouls see S on dips into high 1.08 region if seen
March 18, 2025 at 12:19 pm #21056March 18, 2025 at 12:11 pm #21055Early EURUED gains (whiuch failed abiove 1,0950) may have been in anticipation of this vote
Parliament to vote on 500-billion-euro fund for infrastructure
Also to vote on easing of strict borrowing rules
Conservatives, SPD and Greens expect to reach majority
Measures would mark tectonic shift in spending(Reuters summary)
March 18, 2025 at 11:04 am #21054March 18, 2025 at 10:24 am #21053March 18, 2025 at 9:44 am #21052TIME TO REVISIT THIS ARTICLE AS EURUSD FOCUS IS ON 1.0950
EURUSD HIGH 1.0954 => LAST 1.0944
My Favorite Trading Secret: The Power of the “50” Level
 March 18, 2025 at 9:39 am #21051
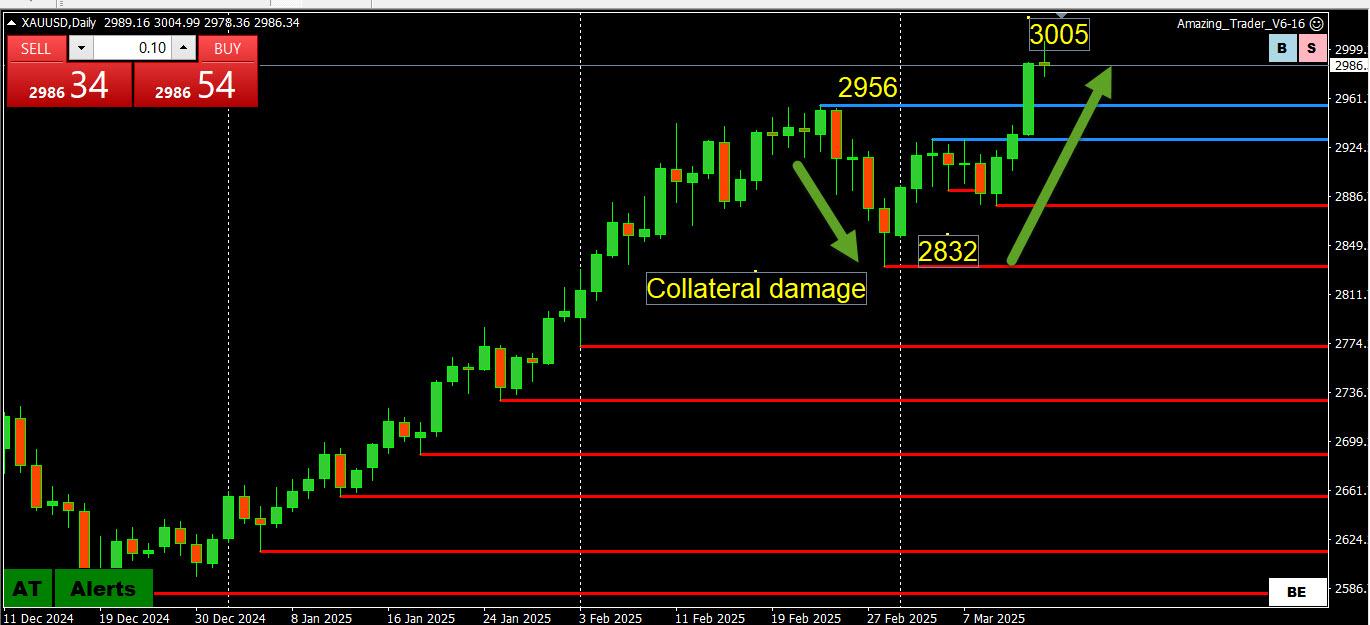
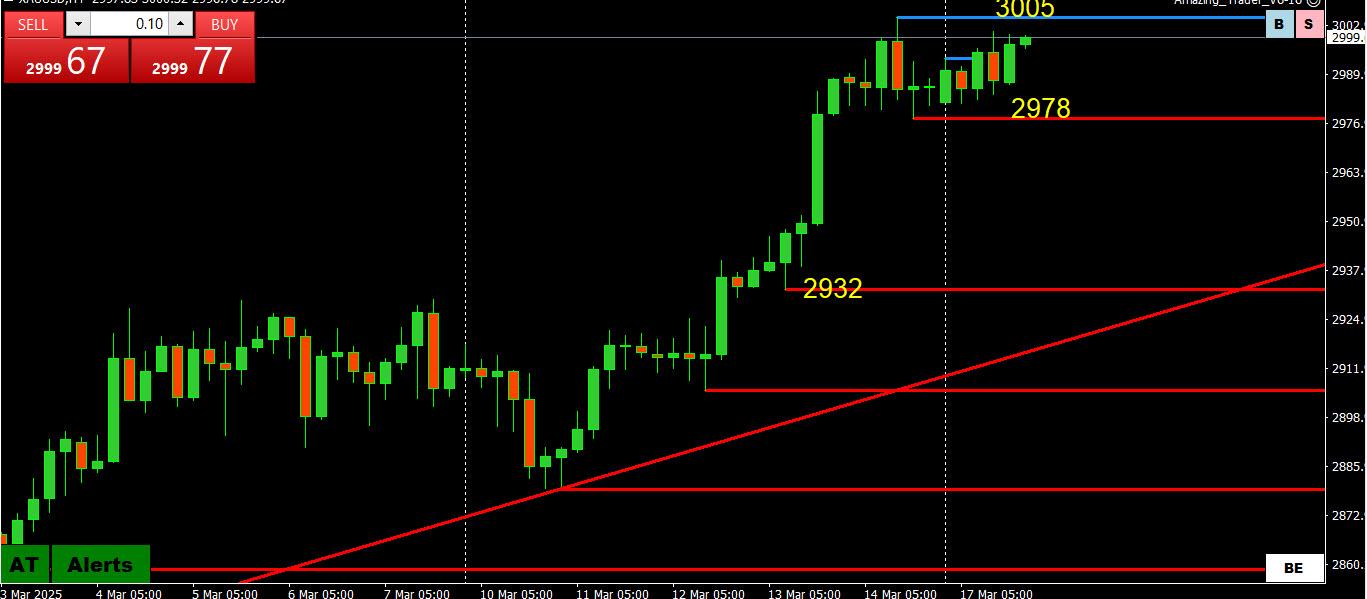
XAUUSD 4 HOUR CHART – WHERE’S THE TOP
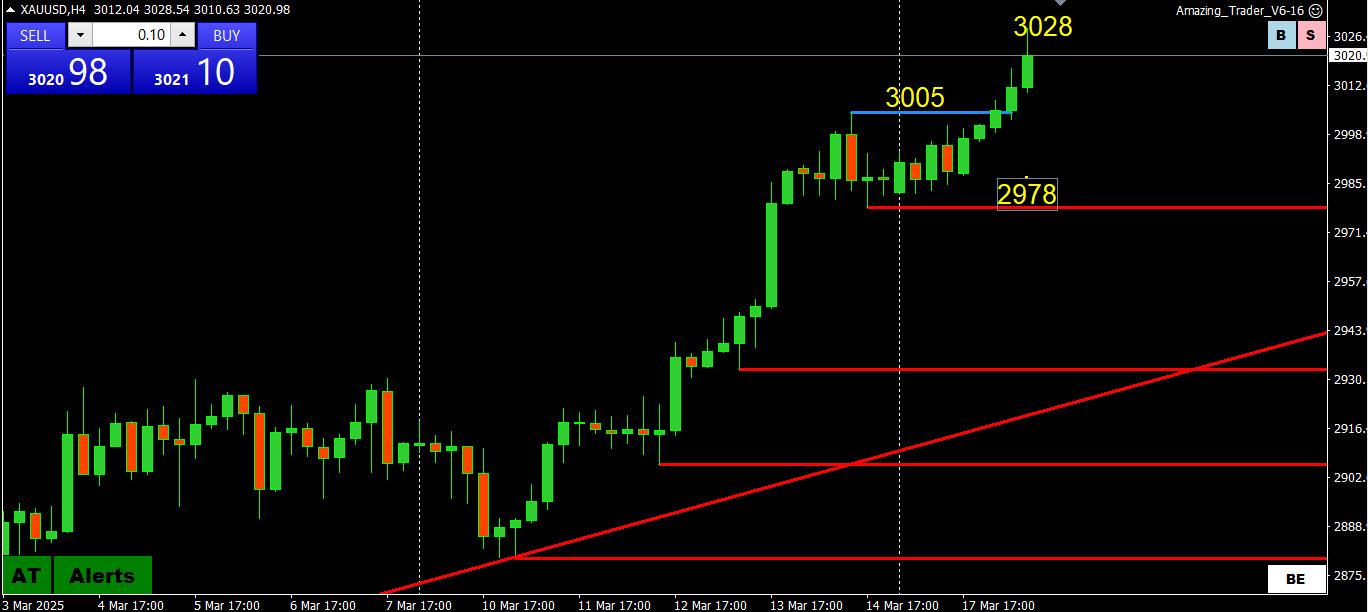
There is no reason to guess at a top until charts tell you there is a reason to do so.
Resistance: Use the most recent (record) high: 3028 so far today
Support: To state the obvious, 3000 will dictate the tone, below 2978 would be the level where charts say there is a top
March 18, 2025 at 8:44 am #21050Using my platform as a HEATMAP shows
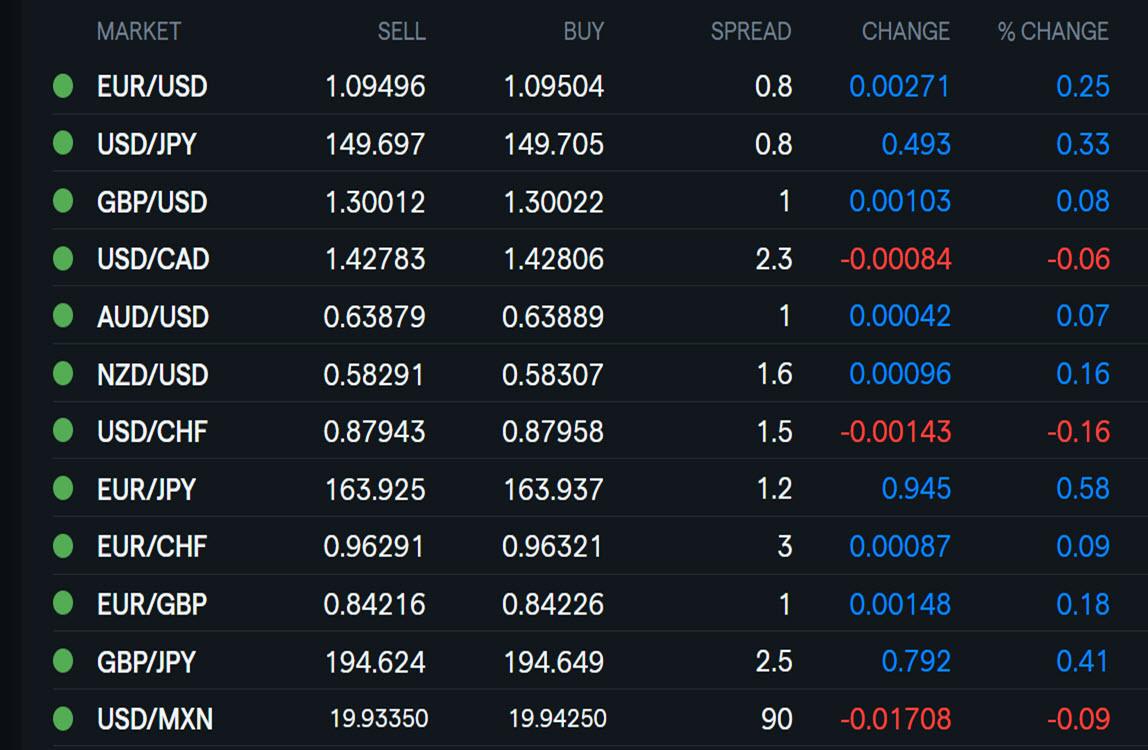
… the dollar trading weaker except vs. a weaker JPY (USDJPY came within spitting distance but backing off after being unable to test 150).
EURUSD break of 1.0947-50 would need to hold to put 1.10 on the radar.
Middle East heating up, supporting oil and gold but little signs of stress elsewhere.
XAUUSD extends record high above 3005.
US stocks steady and seeing if they can build on a 2- day rally
Looking ahead,
Trump-Putin call today
entral bank meeting deluge starts on Wednesday
March 18, 2025 at 4:56 am #21049oh oh oooh… oecd warns
or offers a hint to president trump ?
–Bank of Canada would need to hike interest rates by up to 1.25% in full-blown tariff war, warns OECD
March 17, 2025 at 10:28 pm #21048March 17, 2025 at 10:25 pm #21047USDJPY 4 HOUR CHART – Reacting to risk on
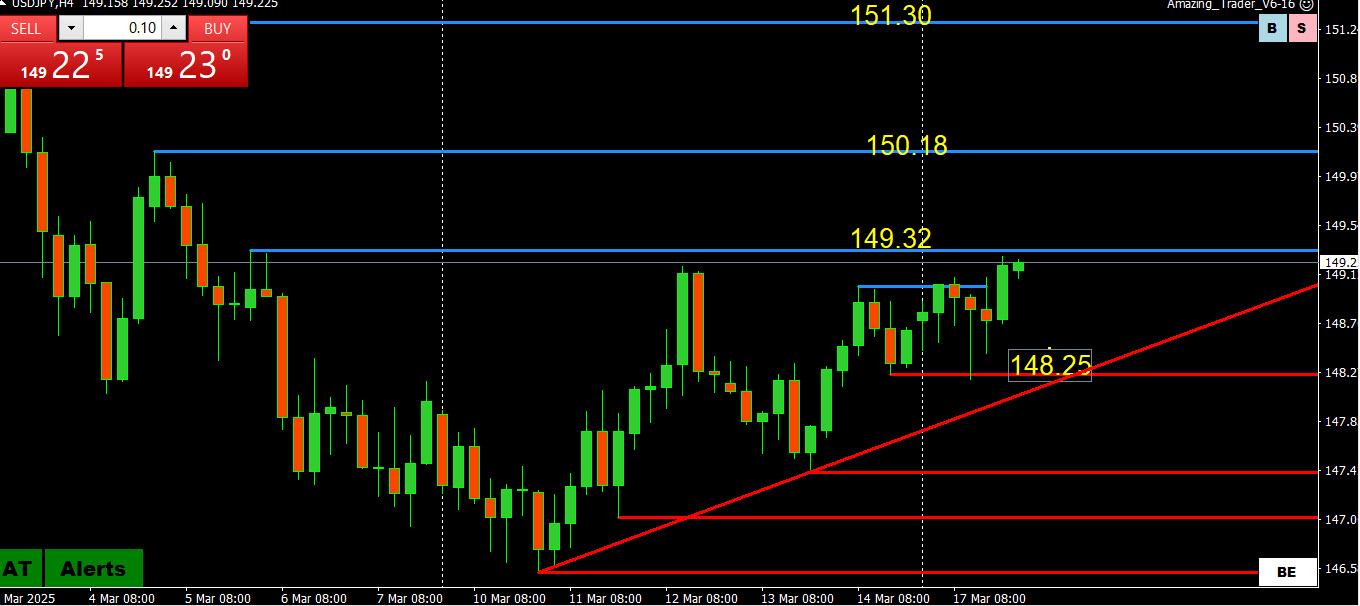
What has the weaker JPY been telling us?
No BoJ rate hike this week?
Foreshadowed a shift out of a risk off mood?
Chart shows 149.32 stands in the way of key levels… 150.18 and 151.30
While 150+ should be tough, only back below 148.00-25 would shift the risk the other way.
March 17, 2025 at 10:18 pm #21046March 17, 2025 at 10:13 pm #21045March 17, 2025 at 10:09 pm #21044March 17, 2025 at 9:03 pm #21041March 17, 2025 at 8:01 pm #21038AnonymousMarch 17, 2025 at 7:22 pm #21037NAS100 4 HOUR CHART – Green shoots
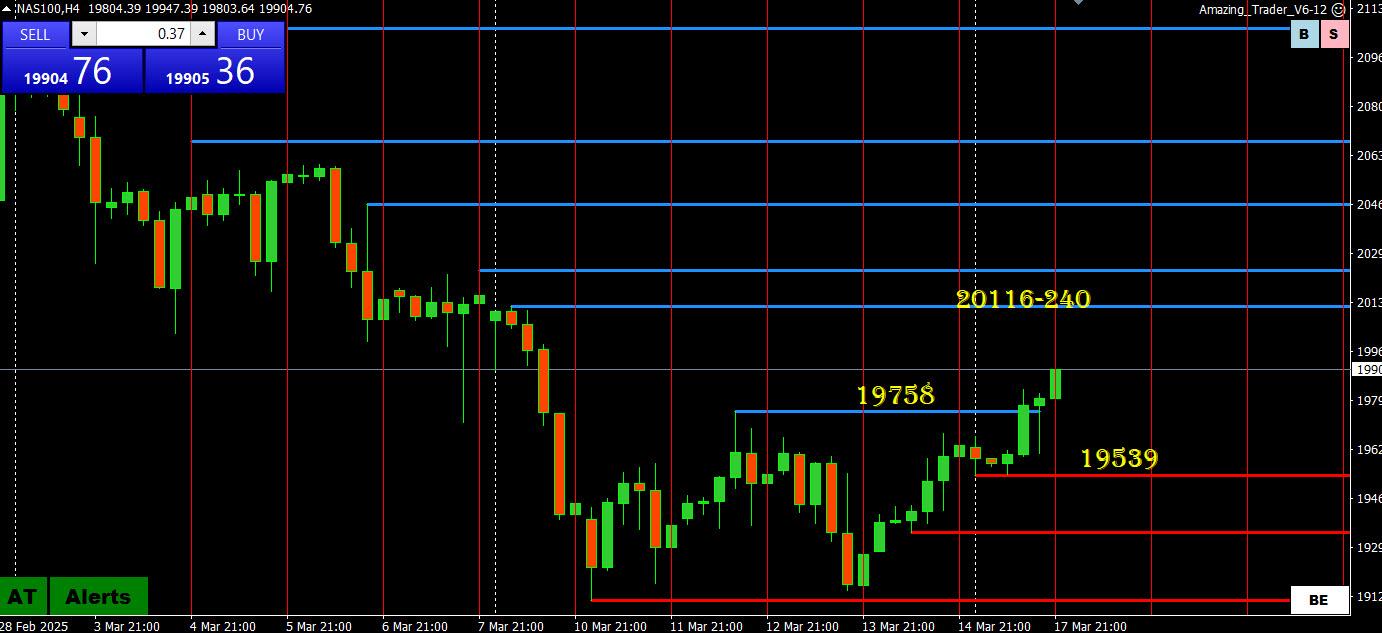
I hate to get carried away with a Monday rally but
There are some green shoots with the move above 19758. Now, to confirm the break of downward momentum, a move through above 20116-240 is needed to confirm.
Also, watch 20120 as above it would break a 4 week pattern of lower lows/lower highs, which at a minimum would further confirm momentum has been broken for now. .
.In any case, keeps a bid if it can trade above 19539.
March 17, 2025 at 6:45 pm #21035March 17, 2025 at 6:38 pm #21034March 17, 2025 at 6:37 pm #21033March 17, 2025 at 5:21 pm #21032March 17, 2025 at 5:17 pm #21031March 17, 2025 at 4:49 pm #21030AnonymousMarch 17, 2025 at 4:47 pm #21029 -
AuthorPosts




- You must be logged in to reply to this topic.
Search
© 2024 Global View