
- This topic has 28,144 replies, 54 voices, and was last updated 6 hours, 49 minutes ago by Belgrade Bobby.
-
AuthorPosts
-
August 19, 2025 at 2:16 pm #29257August 19, 2025 at 2:01 pm #29256August 19, 2025 at 2:00 pm #29255August 19, 2025 at 1:51 pm #29254August 19, 2025 at 1:42 pm #29253August 19, 2025 at 1:25 pm #29252August 19, 2025 at 1:15 pm #29251August 19, 2025 at 1:15 pm #29250August 19, 2025 at 12:50 pm #29249
DXY: US Dollar Seeks Direction Near 98.00 as Forex Traders Brace for Big Fed Week
Key points:· US dollar wobbles in FX deals
· Fed minutes come Wednesday
· Fed boss Powell speaks Friday
US central bank drops minutes Wednesday and boss Powell will be sloshing billions (indirectly) when he takes the stage Friday.
Dollar Dips, Then Flips
· The dollar index DXY couldn’t make up its mind Tuesday, briefly sliding below 98.00 before bouncing back to a session high of 98.30.
· Traders are stuck in wait-and-see mode ahead of a bigFederal Reserve week that includes Wednesday’s meeting minutes and Jay Powell’s much-anticipated Jackson Hole speech.
· The greenback’s seesawing motions highlighted a market that’s jittery and unwilling to commit ahead of fresh Fed signals. Add in thin liquidity on a typical summer day and you’ve got yourself a market you don’t wanna test with two feet at the same time.
Fed Minutes & Policy Split
· Still, price action has been choppy, with forex bros fading moves both ways — a classic sign of directionless positioning ahead of high-volatility events.
· For the week so far, the odds of a September rate cut and mixed global growth signals are keeping a lid on optimism while Trump, Putin, and Zelensky are talking about peace efforts and security guarantees.
· Wednesday brings minutes from the Fed’s July meeting, where officials held rates steady but revealed a notable split: two policymakers actually wanted a cut then and there.
· Traders will parse the meeting summary for clues on inflation worries vs. growth concerns, trying to gauge how close the Fed is to pulling the trigger on easing. Any dovish tilt could crack the dollar index below 98 again, while hawkish undertones risk sending it back above 99.
Powell’s Last Jackson Hole
· Friday’s Jackson Hole symposium is shaping up as the main event, with Powell set to deliver his final Jackson Hole speech as Fed chair before his term ends in May 2026.
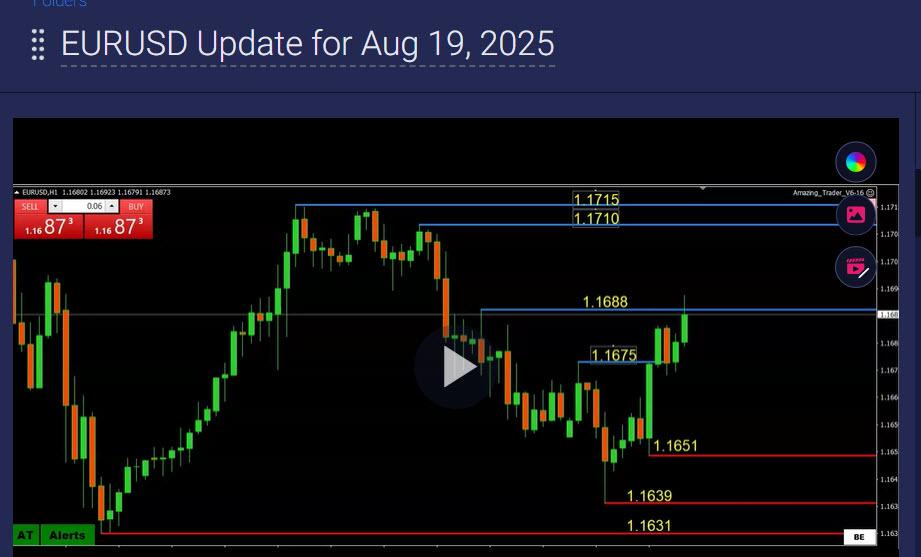
· The EURUSD rebounded sharply to $1.1780 after dipping as low as $1.1639, showing that euro bulls still have fight left despite overhead resistance.
· The GBPUSD also bounced, climbing back to $1.3515 after brushing $1.3496, extending sterling’s run of resilience despite middling UK data.
· The USDJPY stayed flat near ¥147.70, a sign that yen traders have cooled their heavy buying, unwilling to front-run Powell or the Fed minutes.
DXY Index Chart
 August 19, 2025 at 12:42 pm #29248
UK Stocks Slightly Higher
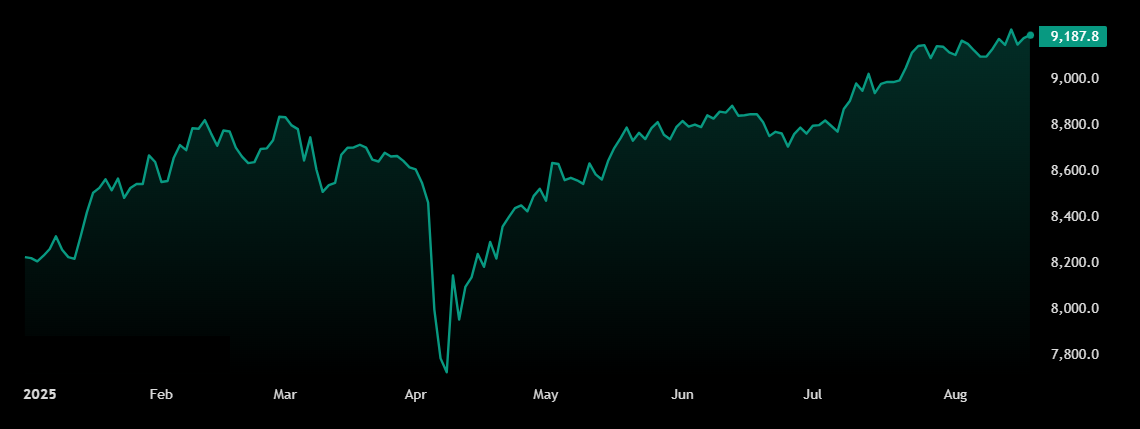
The FTSE 100 edged higher toward 9,190 on Tuesday afternoon, in line with regional peers, amid Ukraine peace hopes, after US President Trump said he was arranging a meeting between his Ukrainian and Russian counterparts.
In equities, JD Sports climbed to the top of the index after Deutsche Bank raised its target price to 100p from 85p.
Copper giant BHP also rallied, supported by a better-than-expected dividend, even as full-year profits fell to a five-year low amid weak Chinese demand for iron ore.
On the downside, defense stocks such as Babcock, BAE Systems, Rolls-Royce and Melrose all slid between 2% and 7%.
 August 19, 2025 at 12:38 pm #29247
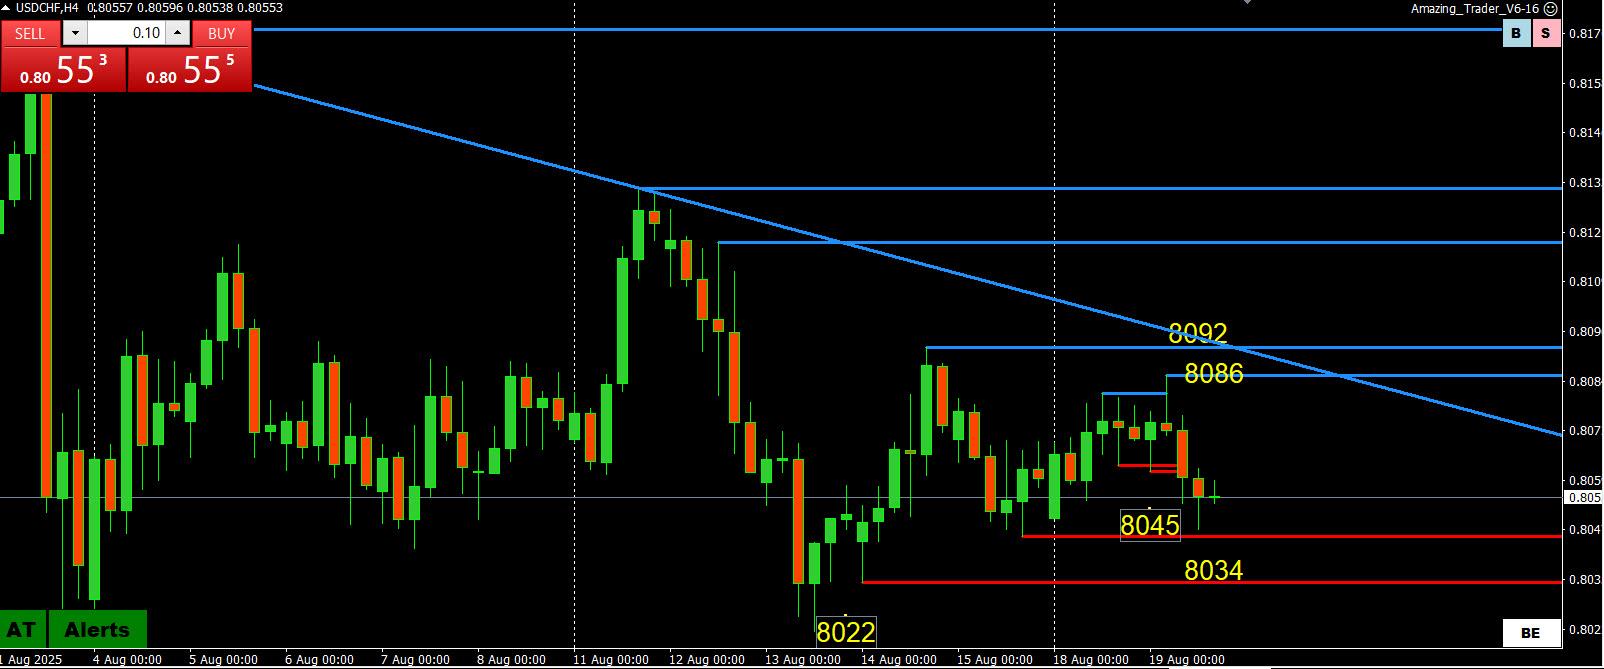
USDCHF Technical Analysis – Eyes on Fed Chair Powell this week
Fundamental Overview
The USD came under some pressure at the start of last week following the US CPI report as the data came mostly in line with expectations. In the following days though, we got some hottish data with the US PPI beating expectations by a big margin, the US Jobless Claims improving further and the inflation expectations in the UMich survey surprising to the upside.
Overall, we ended the week basically flat on the US dollar as the aggressive dovish expectations on the Fed got trimmed a bit. Nevertheless, given the overreaction from the Fed members to the last soft NFP, a September cut looks unavoidable now and only a hot NFP report in September might get us to a 50% probability (although it would certainly diminish expectations for rate cuts after the September one).
The focus has now switched to Fed Chair Powell’s speech at the Jackson Hole Symposium on Friday. Traders will be eager to see if he changes his stance as well. Most likely though, he won’t pre-commit to anything and just reiterate that they will decide based on the totality of the data.
On the CHF side, we haven’t got anything new in terms of monetary policy as the SNB is now in a long pause. The latest Swiss CPI showed a slight improvement in inflation although it’s not important as the central bank will not hike rates for a long time. The market doesn’t expect the SNB to cut anymore.
There’s some focus at the moment on the 39% tariffs that the US slapped on Switzerland. That is likely to be resolved in the near future with the rate being set between 10-20% as we’ve seen for most other countries.
USDCHF Technical Analysis – Daily Timeframe
On the daily chart, we can see that USDCHF is trading at the key support zone around the 0.8050 level. The buyers will likely continue to step in around the support with a defined risk below it to keep targeting the 0.84 handle next. The sellers, on the other hand, will look for a break lower to increase the bearish bets into new cycle lows.
 August 19, 2025 at 12:37 pm #29246August 19, 2025 at 12:34 pm #29245August 19, 2025 at 12:31 pm #29244August 19, 2025 at 12:21 pm #29243August 19, 2025 at 12:21 pm #29242August 19, 2025 at 11:55 am #29241August 19, 2025 at 11:37 am #29240
DLRX 98.04 at 7:35 AM EDT
Res 98.30 & 50; Sup 97.7010-yr 4.328%
euro frolicking just below 1.17
FED vs ECB “easing” race player betting theme
Talking of betting: players appear content pricing in 20bps cut in sept, 50bps be end of year
currently pretty “content” market, sitting calmly n content for nowno substantial effect potential data on docket today
bowman yaks at 2pmAugust 19, 2025 at 11:33 am #29239August 19, 2025 at 10:55 am #29238August 19, 2025 at 10:22 am #29237August 19, 2025 at 10:06 am #29235August 19, 2025 at 10:02 am #29233August 19, 2025 at 9:56 am #29232August 19, 2025 at 9:47 am #29231USDX
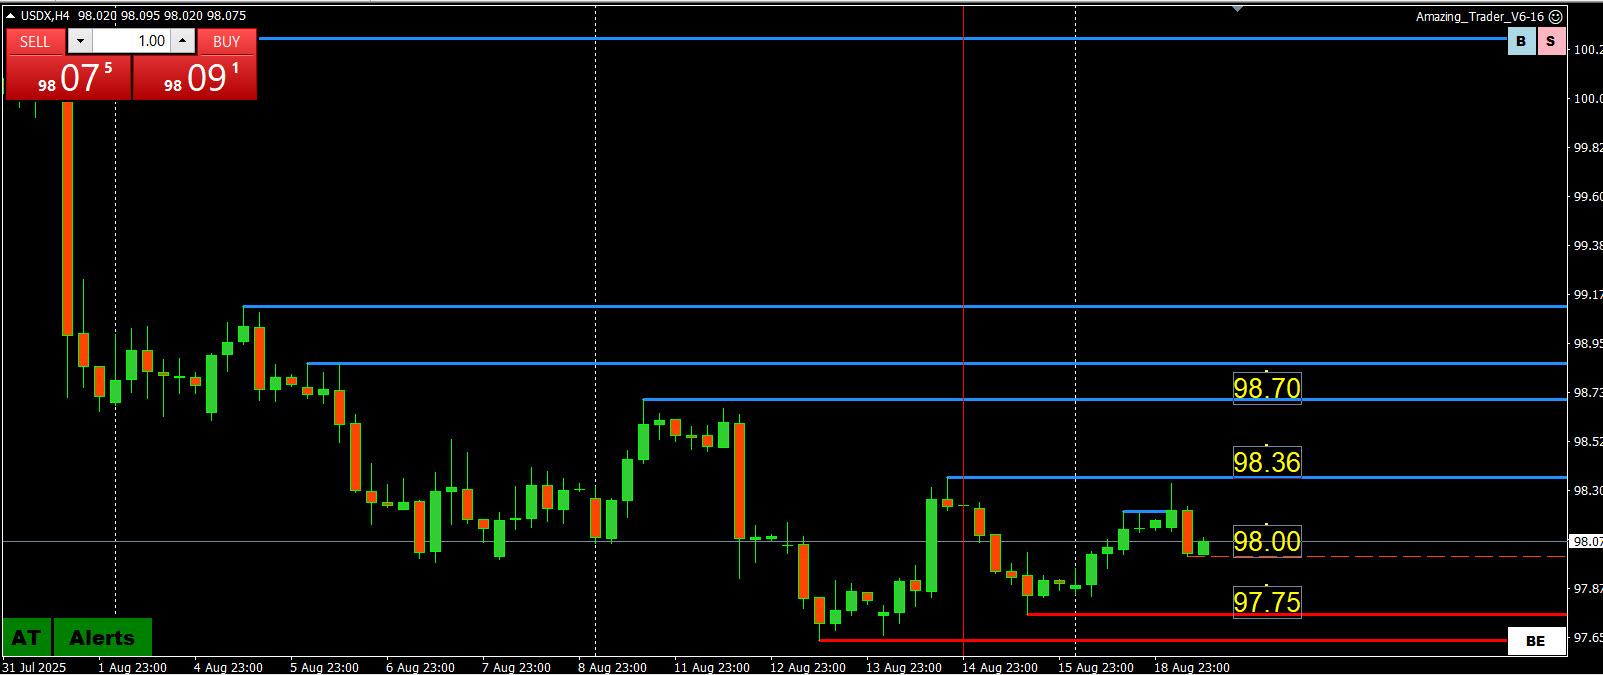
Pause below 98.36 (high 98.345) coincided with a EURUSD low at 1.1639.
Using USDX as a EURUSD proxy (57.6% of the index) indicates the 1.1639 low would need to be taken out for 98.36 to come under attack.
On the downside, 98.00 is pivotal, below it would put 1.17 back on the radar.
97.75 is key support.
USDX 4 HOUR CHART
 August 19, 2025 at 9:34 am #29230
XAUUSD (GOLD)
Continues to struggle to build momentum on either side within a 3300-3400 (tighter 3325-75) range.
Expect more chop until either side of 3300-25/3375-00 is broken where 3350 flips between a magnet and bias setting level (currently below it so a negative bias that would need to break 3325 to buikd some momentum… above it focus staysa on 3350).
XAUUSD 1 HOUR CHART
 August 19, 2025 at 9:26 am #29229
Using my platform as a HEATMAP shows,,,
.. the dollar is trading mixed with only modest net changes so far. EURUSD has bounced after pausing above 1.1630 but remains below 1.17, USDJPY backed down after a brief blip above 148 as attention shifted from Russia-Ukraine to Fed Chair Powell’s speech on Friday. The USD otherwise remains up on the week but off overnight highs.
1. CHF
2. JPY
3. EUR
4. GBP
5. NZD
6. AUD
7. CAD
 August 19, 2025 at 2:24 am #29228
Was the Bitcoin price bottom $114.7K?: Data suggests it’s time for a reversal
• The Bitcoin options skew and stablecoin activity show fear remains contained, pointing to limited downside pressure.
• Spot BTC ETF flows and top trader positioning confirm liquidity and resilience, signaling recovery potential above $120K. Bitcoin (BTC) fell to an 11-day low of $114,755 on Monday, igniting debate over whether Thursday’s record high signaled the end of the current bull run. Yet four distinct indicators suggest the correction is only temporary and that Bitcoin may soon reclaim the $120,000 mark.
The Bitcoin options skew metric climbed to its highest point in four months, highlighting sudden and excessive fear. In balanced conditions, the skew should move between -6% and +6%. When demand for protective put options increases, the indicator jumps above the neutral band, while periods of FOMO push it below.
History shows such events often create strong buying opportunities. On Aug. 5, a similar skew jump was followed by a $9,657 rally within six days. Likewise, when Bitcoin plunged to $74,587 on April 9, the skew touched 13%, setting the stage for a double bottom and an $11,474 recovery in just four days.
Some investors are now afraid that outflows from spot Bitcoin exchange-traded funds (ETFs) could begin, especially after a seven-day inflow streak ended on Friday. Yet the panic seems misplaced. Between July 31 and Aug. 5, the ETFs registered $1.45 billion in net outflows, which translated into only a modest 6% correction to $112,000.
Bitcoin top traders did not reduce their longs, reinforcing the bullish thesis Positions from top traders at OKX and Binance show little reaction to the latest price drop. These data cover spot, margin and futures markets, offering a broader view of how professional players are positioned.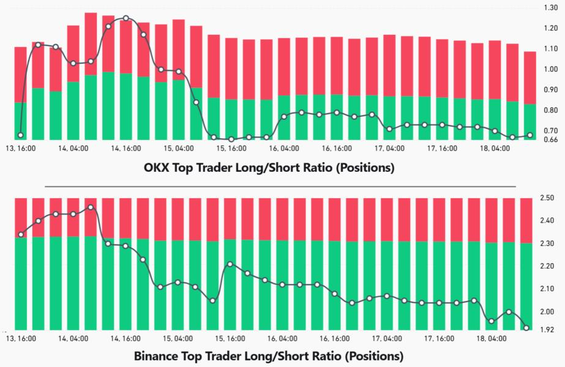 August 19, 2025 at 12:48 am #29227
Ethereum Lost 2.95% to $4337.97
Ethereum is down $132.01 today or 2.95% to $4337.97
• Largest percentage decrease since Aug. 14, 2025, when it dropped 3.92%
• Snaps a two day winning streak
• Up 16.13% month-to-date
• Up 29.7% year-to-date
• Down 10.85% from its all-time intraday high of $4865.81 on Nov. 10, 2021
• Up 65.83% from 52 weeks ago (Aug. 19, 2024), when it traded at $2615.95
• Down 9.44% from its 52-week intraday high of $4790.13 on Aug. 14, 2025
• Up 204.70% from its 52-week intraday low of $1387.85 on April 9, 2025
• Traded as low as $4228.80
• Down 5.40% at today’s intraday low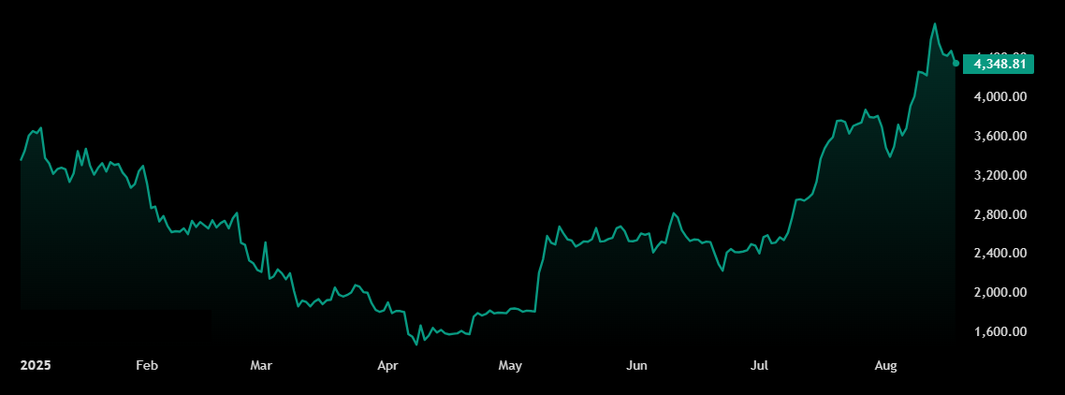 August 18, 2025 at 11:26 pm #29226
Dollar Supported by Higher T-Note Yields
The dollar index DXY on Monday rose by +0.30%. The dollar moved higher Monday on carryover support on concern that last week’s CPI and PPI reports showed an acceleration of prices that could keep the Fed from cutting interest rates at next month’s FOMC meeting.
The reduced chances of a Fed rate cut pushed the 10-year T-note yield up to a 2-week high on Monday at 4.35%. Gains in the dollar were limited after Monday’s news showed the Aug NAHB housing market index unexpectedly declined.
The US Aug NAHB housing market index unexpectedly fell -1 to 32, weaker than expectations of an increase to 34.
Gains in the dollar were limited due to underlying foreign investor concern about the possibility of a politically-driven US monetary policy, following US Treasury Secretary Bessent’s appearance last Wednesday, which seemed to give the Fed marching orders on how much to cut interest rates. The markets are awaiting the outcome of today’s meeting between President Trump and European leaders on any progress toward ending the Russian-Ukrainian war.
The outcome could have macroeconomic implications regarding tariffs and oil prices, and could, of course, have significant consequences for European security.
The markets continue to adjust to the inflation outlook following Thursday’s hawkish PPI report. Following the report, the markets erased any hopes of a -50 bp rate cut at the Fed’s September meeting and pulled back expectations for a -25 bp rate cut to 84% area from 93% before the report.
Federal funds futures prices are discounting the chances for a -25 bp rate cut at 84% at the September 16-17 FOMC meeting and at 51% for a second -25 bp rate cut at the following meeting on October 28-29. EUR/USD Monday rose by +0.47% due to strength in the dollar. The yen also continues to be undercut by concern that US tariff policies will harm the Japanese economy.
On the positive side for the yen was Monday’s news that showed the Japanese Jun tertiary index rose more than expected. The Japan Jun tertiary index rose +0.5% m/m, stronger than expectations of +0.2% m/m. December gold (GCZ25) on Monday closed down -4.60 (-0.14%), and September silver (SIU25) closed up +0.054 (+0.14%).
Precious metal prices on Monday settled mixed, with gold prices falling to a 2-week low. Strength in the dollar on Monday was bearish for metals. Also, higher T-note yield undercut gold prices after the 10-year T-note yield climbed to a 2-week high on Monday at 4.35%.
Gold prices are also under pressure due to reduced chances for a Fed rate cut at next month’s FOMC meeting, following a bearish July PPI report last Thursday that knocked the chance of a Fed rate cut down to 84% from 93% before the report.
Gold continues to have safe-haven support related to US tariffs and geopolitical risks, including the conflicts in Ukraine and the Middle East. Fund buying of precious metals continues to support prices after gold holdings in ETFs rose to a 2-year high last Friday, and silver holdings in ETFs reached a 3-year high last Thursday.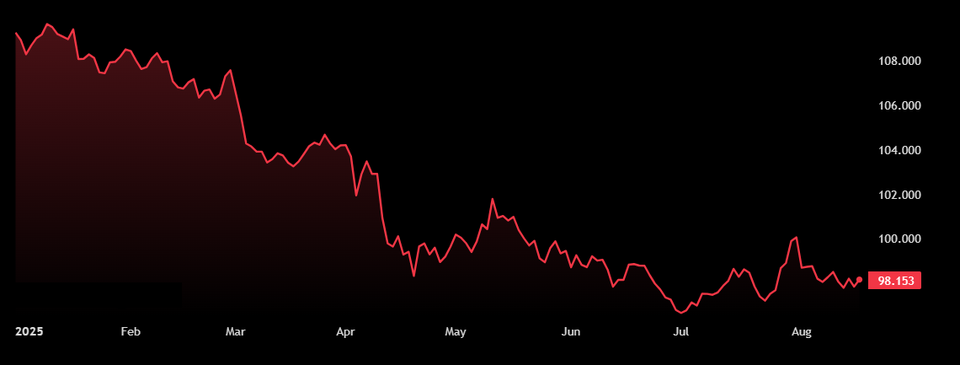
-
AuthorPosts





- You must be logged in to reply to this topic.
Search
© 2024 Global View