
Failed retracement
What is the one word that helps explain movements in the markets?
Is it technicals? News? Momentum? Fundamentals?
All of these influence prices. However, there is another way to look at market behavior that can help put the action into perspective.
The word is “failure.”
A market attempts to move in one direction but cannot follow through. That failure can create an opportunity in the opposite direction.
A higher low forms when sellers fail to reach or break the previous low. A lower high forms when buyers fail to reach or break the previous high. Double and triple tops or bottoms develop when repeated attempts to break a price area fail.
These are familiar chart patterns. Behind them is a simple question: What is the market trying to do, and what happens when it cannot do it?
Understanding this can help traders view price action as a developing opportunity rather than something they must constantly chase.
Failed retracement
Example: USDCAD Daily chart: Retracement or reverrsal after running into stiff resistance at 1.43?
61.8% (1.3950) FIBO retracement level just hit at 1.3950, holding sdo far Oct 30, 2026
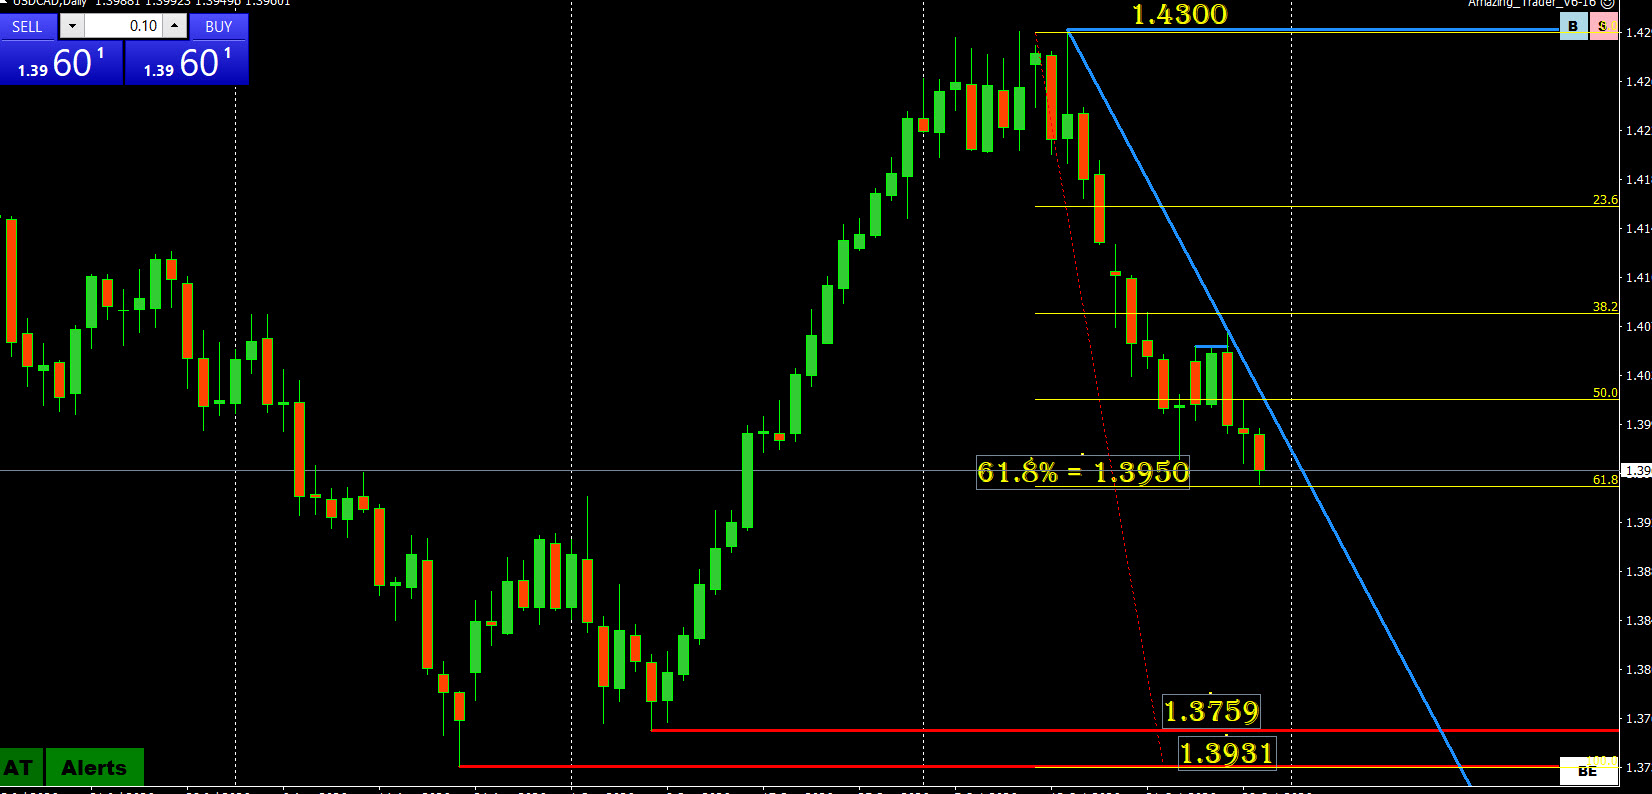
Answer: Jury is out as long as Fibonacci retracement levels (FIBOS) hold.
FIBOS: USDCAD 1.3731 => 1.4300

Note: The most commonly Fibonacci retracement(FIBO) levels to watch include:
- 23.6%
- 38.2%
- 50% (not a Fibonacci level but widely watched)
- 61.8%
- 78.6%
Of these, the 38.2%, 50%, and 61.8% areas are a main ones.
Embrace the Retrace: How to Turn Market Pullbacks Into Trading Opportunities
What Is a Failed Retracement?
A retracement is a move against the prevailing trend. In an uptrend, it is a pullback. In a downtrend, it is a recovery.
A failed retracement occurs when that move against the trend loses momentum and the original direction resumes.
For example, a rising market begins to fall. Sellers appear to have gained control, but the decline stalls, buyers return, and prices turn higher.
The attempt to move lower has failed to develop into a sustained reversal.
The same process works in reverse when a rally within a downtrend stalls out and selling resumes.
A retracement can become a reversal, so traders cannot assume every correction will fail. The task is to recognize evidence that the move against the trend is struggling and know what would invalidate that interpretation.
Failed retracement – How Failures Help Sustain Trends
Markets rarely move in a straight line. Trends generally include pauses, corrections, and repeated attempts to move in the opposite direction.
One way to understand a continuing trend is as a series of failures by the opposing side.
Higher Lows Reflect Failed Selling
During an uptrend, sellers periodically push prices lower.
If the decline stalls above the previous significant low and buyers regain control, a higher low may form.
The chart shows the pattern. The underlying message is that selling pressure failed to change the upward.
That failure can provide the foundation for another attempt at the high.
Lower Highs Reflect Failed Buying
During a downtrend, some sellers take profits and other traders buy in anticipation of a bottom.
Prices recover, but the rally eventually stalls below the previous significant high.
If selling resumes, a lower high may form. Buyers have failed to change the downward structure, leaving the market vulnerable to another decline.
Repeated failures against the trend can help sustain momentum with the trend.
Why Retracements Can Prepare the Next Move
Traders often find corrections frustrating. A position moves into profit, only to give some of it back.
Yet a retracement can change the positioning that helped slow the original move.
Consider an uptrend.
As prices rise, some traders take profits on their long positions. Others decide the market has gone far enough and sell in anticipation of a top.
The resulting pullback may attract more countertrend selling while encouraging existing buyers to reduce their exposure.
If that decline then fails, several sources of buying may emerge:
- New buyers enter in the direction of the trend.
- Traders who took profits rebuild their positions.
- Traders who sold against the trend buy back their shorts.
These flows can reinforce one another.
Some of the earlier profit-taking has also already occurred. Depending on available liquidity and new orders, there may be less immediate selling to absorb renewed buying.
The same process can occur in reverse during a downtrend.
The key takeaway is that once overall positioning with the trend is reduced (and some looking to pick tops or bottoms are positioned the other way), a market has less ability to absorb fresh buying (or selling) in the direction of the existing trend, often leading to a fresh high (or low).
This is why I describe retracements as a necessary evil. They interrupt the trend, but they can also help prepare the conditions for its next move.
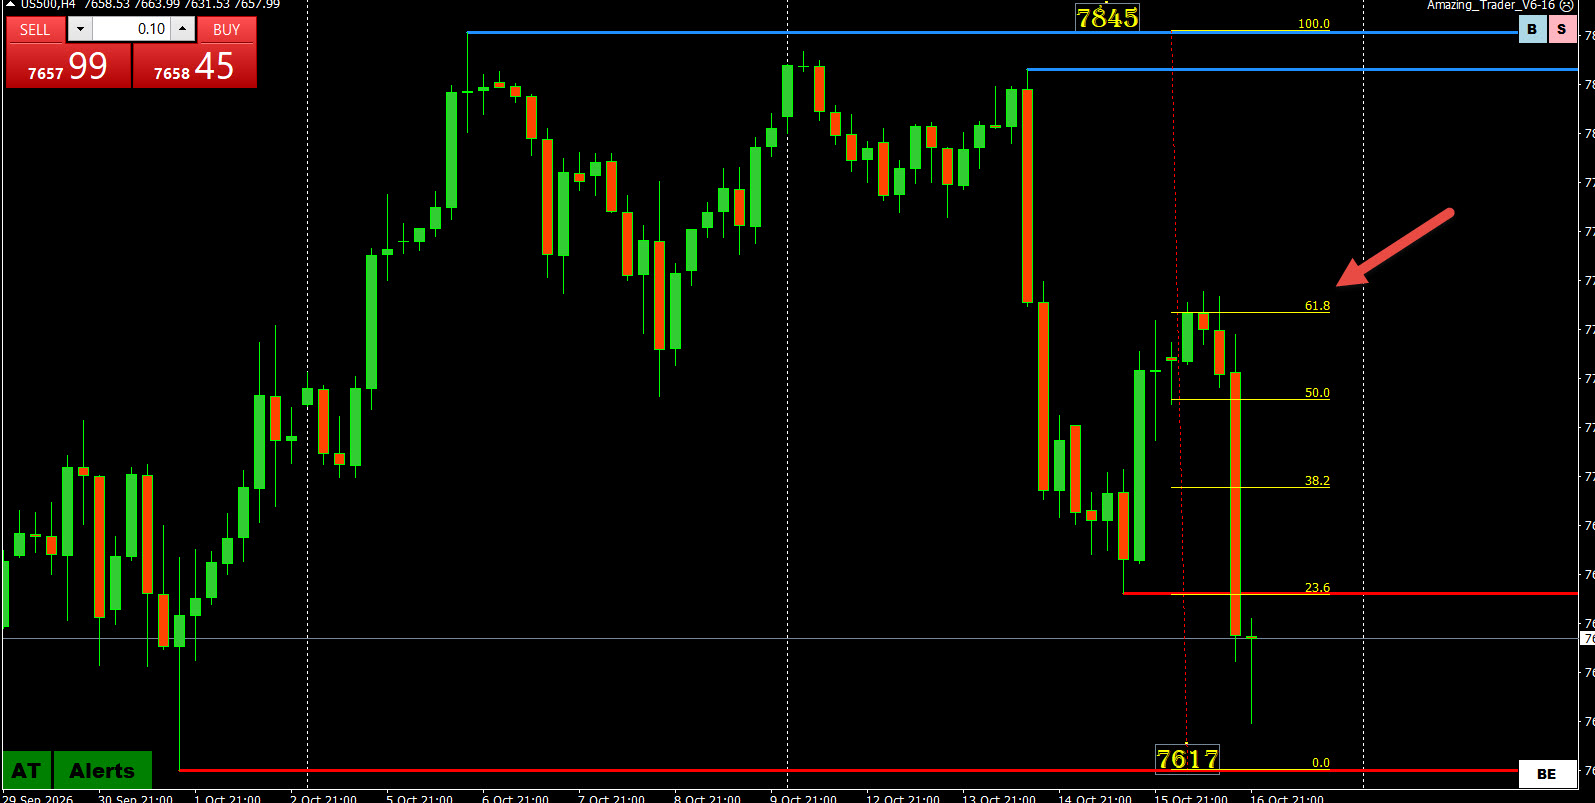
A Failed Retracement Example
- US500 fall from 7845 => 7672 after a lower high
- Move from 7672 => 7765 competed a 61.8% retracement (plus a few pts)
- Failed retracement (high 7765) setup move to a new low.
When the Correction Keeps Going
In the above example, rather than a new low, a pause above 7672 followed by a break of 7765 would have indicated momentum reversing to the upside.
How to Use Failed Retracements in Trading
Understanding why corrections can affect positioning is the first step. The next is finding a practical way to use that information.
Identify the Side to Trade
Start with the broader chart structure.
Is the market making higher highs and higher lows? Lower highs and lower lows? Or is it moving sideways?
A failed retracement is easier to interpret when there is a reasonably clear prevailing direction.
Identifying the side to trade is a major part of the job.
Finding a suitable entry and a worthwhile risk/reward opportunity comes next.
Look for Evidence of Failure
A correction has not failed simply because the price looks attractive.
Look for behavior suggesting the opposing move is losing control. This might include repeated unsuccessful attempts to extend the correction, rejection of an important level, or a break of a minor price structure in the direction of the broader trend.
These observations provide a basis for a trading decision. They do not guarantee the outcome.
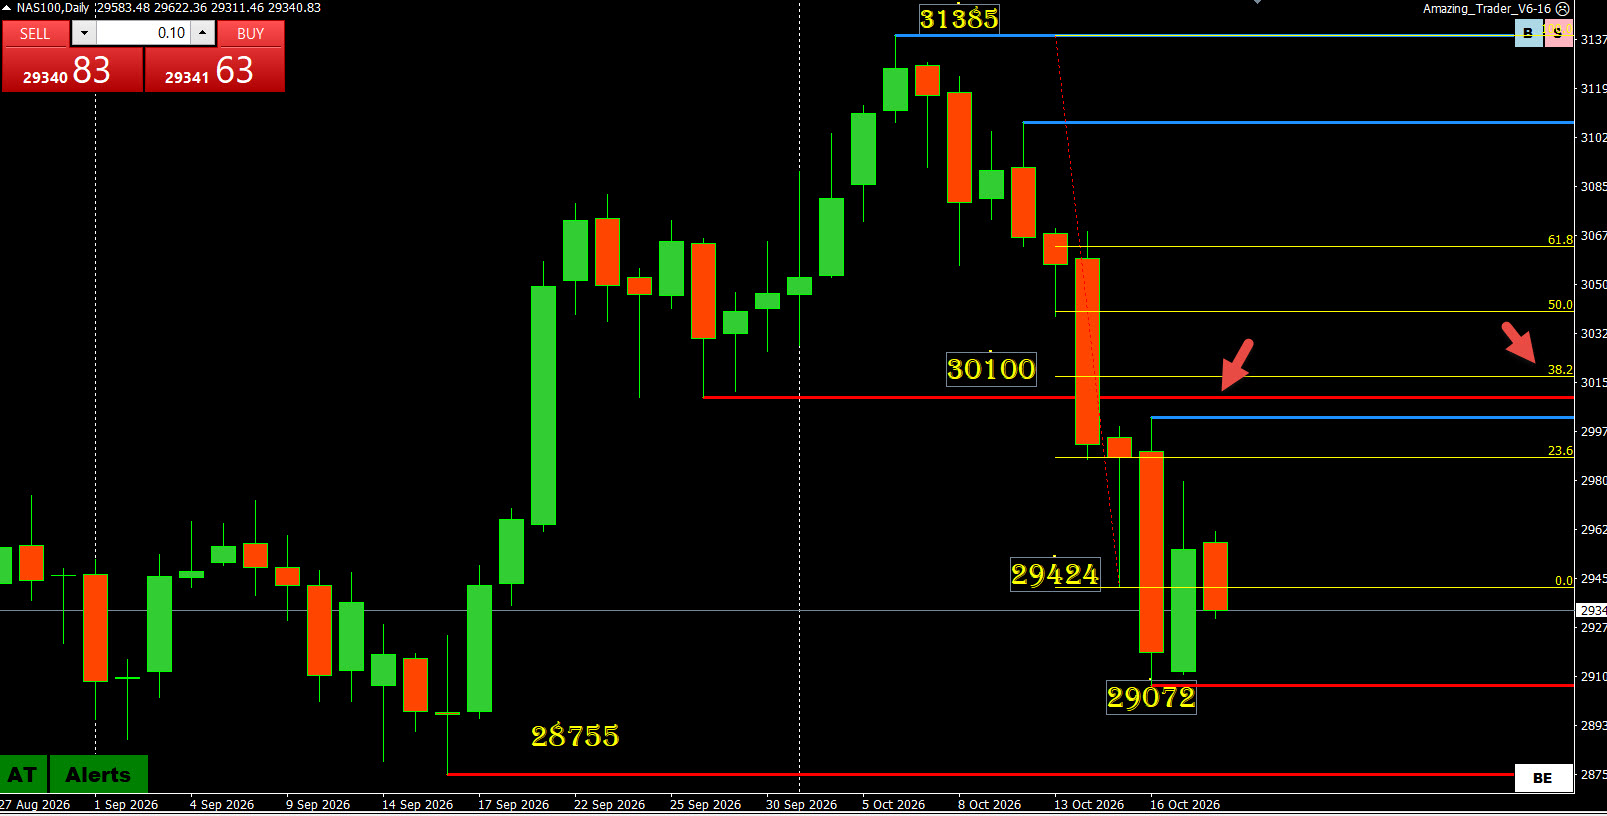
Example:
NAS100 bounce from pauses just beloiw a former support (30100 = red line) and the 38.2%% FIBO level
What follows is a failed retracement and a move to a new low (31385 => 29424 (low) => 30027 (retracement high = blue line) => 29072 (new low)
Define What Would Make the Trade Wrong
Before entering, identify the price level or market behavior that would invalidate the idea.
Then consider the stop location, position size, and potential reward.
An accurate view of market direction can still lead to a poor trade if the entry leaves too much risk relative to the available opportunity.
The goal is to turn an interpretation of price action into a trade with a defined cost if that interpretation proves wrong.
Failed retracement – Why Countertrend Traders Must Watch for Failure
Traders often cannot resist trying to pick tops and bottoms.
The objective might be a small correction on a five-minute chart or a larger retracement on an hourly or daily chart.
Whatever the timeframe, the danger is similar: the move against the trend can end before the trader exits.
Once a correction fails, prices can snap back quickly. Orders in the direction of the trend may arrive at the same time that countertrend traders are closing their positions.
That is why holding out for the last pip or point can be costly.
A countertrend trade needs an exit plan that accounts for the possibility that the correction will lose momentum sooner than expected.
What If the Expected Failure Does Not Happen?
Sometimes the most useful information comes from what the market does not do.
An uptrend that previously recovered quickly from pullbacks may stop recovering. A downtrend that repeatedly rejected rallies may suddenly allow a recovery to extend.
When corrections no longer fail in the familiar way, the trend may be losing strength.
The market could be entering a range, developing a deeper correction, or beginning a reversal.
For this reason, identify the key levels that would change the technical picture if broken. Also watch whether the market sustains a break or quickly returns to its previous range.
The absence of an expected failure is a reason to reassess.
Putting Failure Into Perspective
News, fundamentals, technical levels, and positioning all influence markets. Failure provides a useful way to interpret the resulting price action.
A decline that cannot continue may prepare the ground for renewed buying. A rally that cannot hold may create an opportunity for selling.
This perspective encourages a trader to ask three questions:
- What is the market attempting?
- Is it following through?
- What would show that my interpretation is wrong?
A failed retracement can become a trading opportunity when the move against the trend loses control and the original direction begins to reassert itself.