
- This topic has 6,444 replies, 28 voices, and was last updated 1 hour, 24 minutes ago by GVI Forex.
-
AuthorPosts
-
February 15, 2024 at 2:46 pm #1639February 15, 2024 at 2:38 pm #1638
9:30 ny
DLRx 104.19 (somewhat down a bit) / 10-yr 4.212 / euro 1.0780observation: dlryen and us yield appear correlated
Looks like players are not done selling the dlr just yet
—-
13:15 – fed’s waller yaks – on dlr’s int’l role (hello janet, hello putin)
19:00 – bostics yaks on outlook and policy (yeah !, lol)February 15, 2024 at 2:32 pm #1637February 15, 2024 at 1:38 pm #1633February 15, 2024 at 11:45 am #1626interest policy at fault and to blame ?
–
* For the whole of 2023, Japan’s nominal GDP grew 5.7% over 2023 to come in at 591.48 trillion yen, or $4.2 trillion based on the average exchange rate in 2023.* Germany on the other hand, saw its nominal GDP grow 6.3% to reach 4.12 trillion euros, or $4.46 trillion based on last year’s average exchange rate.
Japan is no longer the world’s third-largest economy as it slips into recession
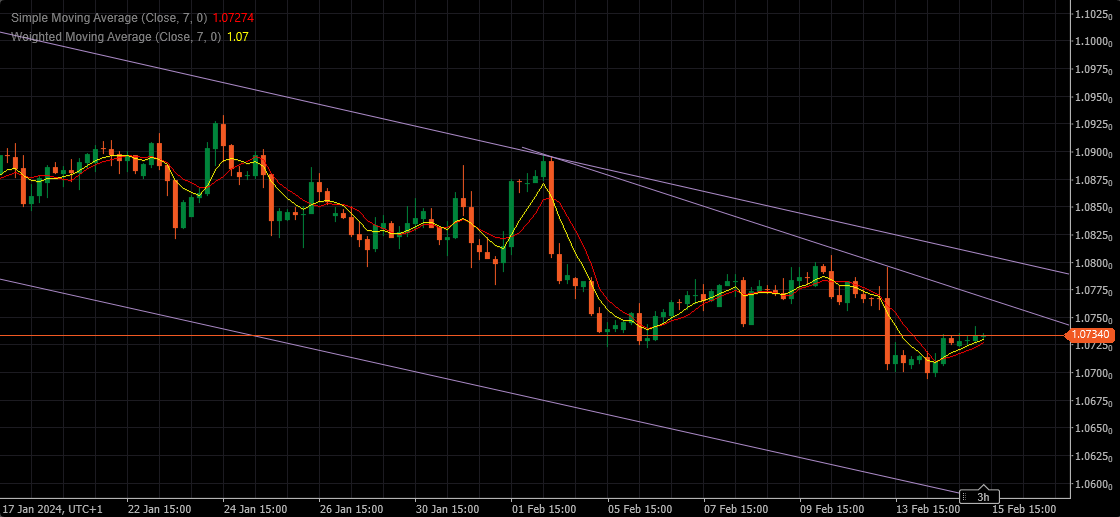
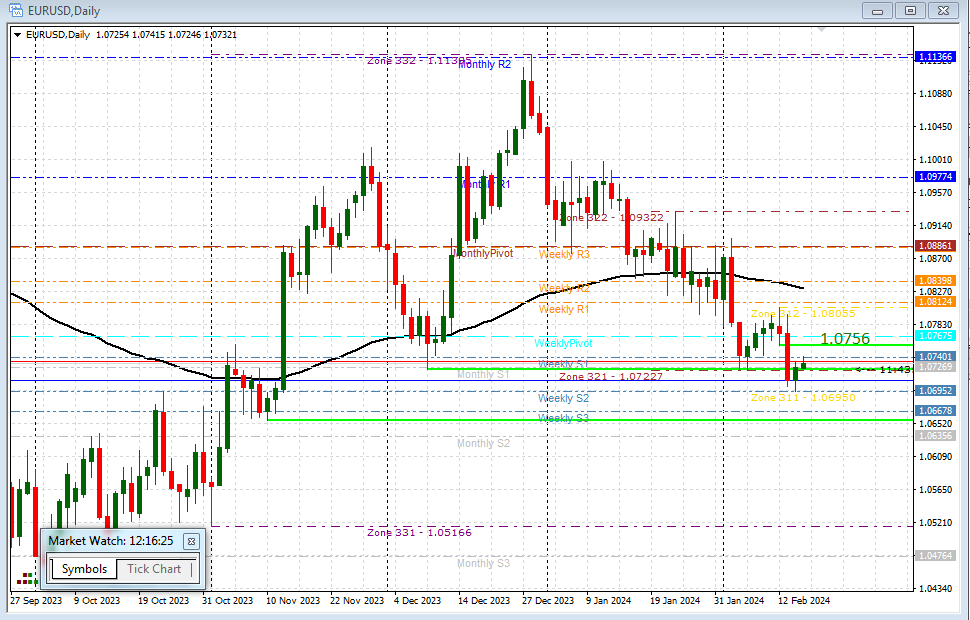
February 15, 2024 at 11:35 am #1625February 15, 2024 at 11:15 am #1624February 15, 2024 at 10:48 am #1623EURUSD
After reaching the new low yesterday, another sideways to Up formation is in the creation.
Immediate support is at 1.07250/300
It is trying to reach 1.07650 , and it should, prior to the next leg down.
Albeit, we can see some brief tests of 1.07000 area, but we need that Uptick to be done , for the downtrend to continue in full force.
 February 15, 2024 at 10:23 am #1622February 15, 2024 at 10:00 am #1621
USDJPY 1-hour chart
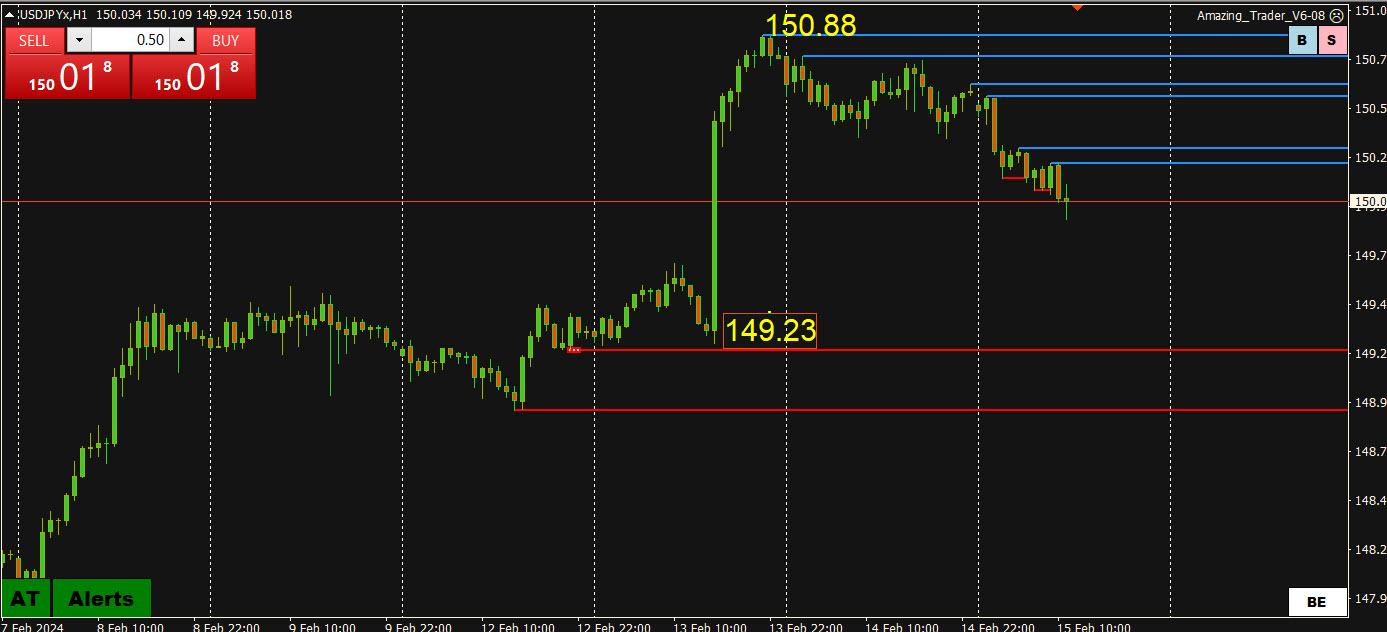
JPY is the strongest currency today.
After the sharp spike on US CPI, USDJPY is currently retracing.
With no supports (red lines) until 149.23,
FIBO levels: Check out our Fibonnaci calculator
50% = 150.055 (broken)
61.8% = 149.86
76.4% = 149.58
So, as long as 149,86 holds, the focus stays on 150, which will dictate the tone for this pair.
February 15, 2024 at 6:59 am #1620February 15, 2024 at 2:07 am #1619EURUSD Analysis: Downtrend Continues, Resistance and Downside Targets
The EURUSD pair remains below a falling trend line on the 4-hour chart, indicating the continuation of the downtrend from 1.1139.
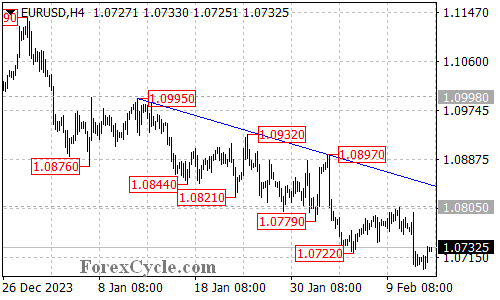 As long as the price remains below the falling trend line, it is likely that the downside move will persist. The next target area for the pair would be around 1.0670, followed by 1.0600.
The initial resistance level is located at 1.0750. A breakthrough above this level would suggest a consolidation phase for the downtrend is underway. In such a scenario, the price could retest the 1.0805 resistance level. If this level is surpassed, it may trigger further upside movement towards the falling trend line.
It is important to note that only a break above the trend line resistance would indicate the completion of the downtrend.
In summary, the EURUSD pair remains in a downtrend, with the price staying below a falling trend line on the 4-hour chart. Downside targets have been identified, while resistance levels have also been highlighted for potential retracements. The completion of the downtrend would require a significant break above the trend line resistance.
February 14, 2024 at 8:42 pm #1618February 14, 2024 at 7:14 pm #1614February 13, 2024 at 1:50 pm #1543
Lesson
It is generally safer to trade in anticipation of how a market will trade ahead of a data release than holding a position into the data.
This is my philosophy and you can see why after the surprise CPI print.
US 20-year 4.28% – note JP’s past posts of 4.20% being sort of usd pivot.
———————
The best way to trade is holding a position and let it rip into the data… it’s like getting on the big kahuna to the shore line… This ain’t just talk I do this in real life…sometimes you guys sound so scared that i read your posts and then I get scared too!!!
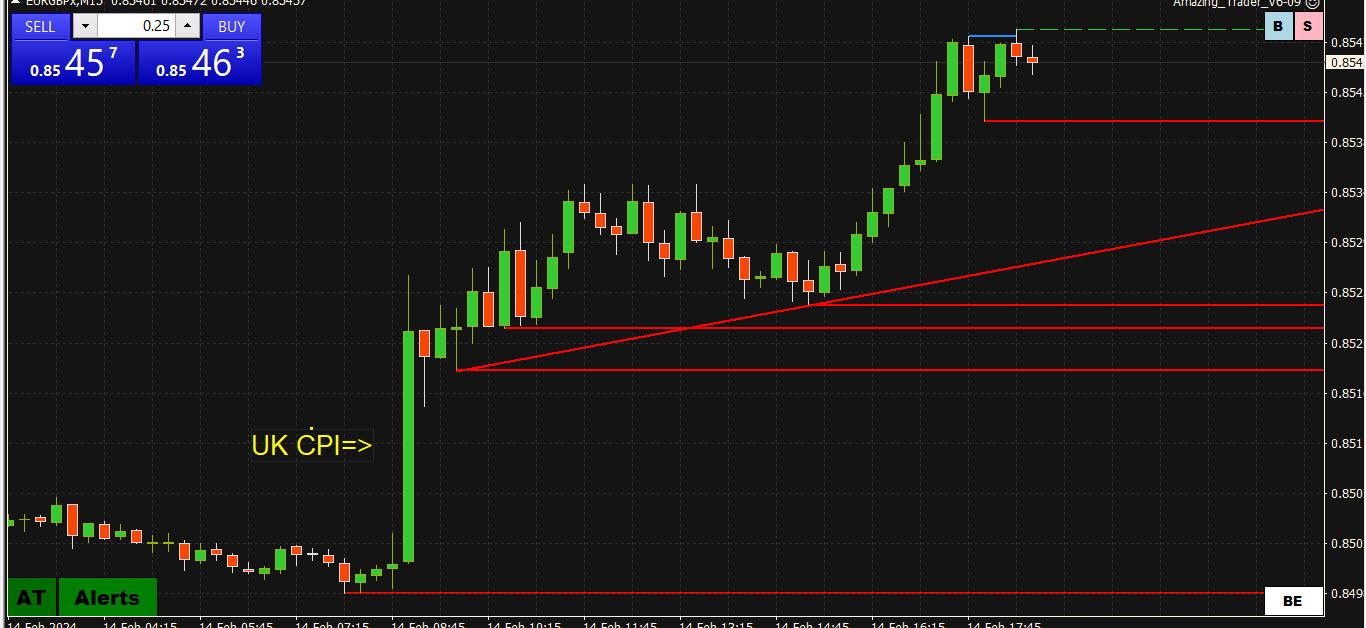
February 14, 2024 at 4:58 pm #1613EURGBP firmer => weaker GBPUSD => firmer EURUSD
The GBP’s reaction in GBP (weaker) to a miss in UK CPI underscores an ultra-sensitivity to any data that shifts expectations of rate cuts.
Look at this EURGBP chart where demand for the cross is one reason why EURUSD has taken on a bid.
EURGBO 15-minute chart’
EURGBP => weaker GBPUSD => former EURUSD
The GBP’s reaction in GBP (weaker) to a miss in UK CPI underscores an ultra-sensitivity to any data that shifts expectations of rate cuts.
Look at this EURGBP chart where demand for the cross is one reason why EURUSD has taken on a bid.
I call this “Using crosses to help trade spot fx“”
EURGBO 15-minute chart’
 February 14, 2024 at 4:44 pm #1612February 14, 2024 at 4:22 pm #1611February 14, 2024 at 4:14 pm #1610
Not tradable on the basis of 1- timing and or 2- Frequency. There’s nothing saying it HAS TO BE 3 cuts of 25 bps. It could come as a combination of…
Time for the financial press and those calling for financial armagedon to tap the breaks and give yesterdays CPI some perspective. The YOY number actually dropped sowing signs of annual improvement. The MOM numbers missed expectations by 0.1 otherwise known as a rounding error OR like previously mentioned maybe expectations were just too low…..
This number alone is not enough to send equities into a tailspin or the USD to the moon. IMO I see it as a range trade 1.0650-1.0750 until next NFP with some bias towards relative weakness in the CHF and JPY….
February 14, 2024 at 4:06 pm #1609FED’s policy mistake
according to mohamed
–
“june and three cuts is much more realistic BUT
IF the FED delays much longer than that AND doesn’t come through with three cuts … then THAT will be the policy mistake” – Feb 14, 2024 Mohamed El-ErianSo here I have a Qtn: is mohamed’s fed mistake idea tradeable ?
animal spirit wants to know
TIA !February 14, 2024 at 3:52 pm #1608catching up on some pundits
–
Hot CPI data was a ‘wake-up call’ to people who got carried away, says Mohamed El-Erian here mohamed informs cnbc’s joe that “the problem is the marketplace”everything and everyone is a “problem” according to the president of Queen’s College. what does he predict as remedy ? see the 5:15min +
-
AuthorPosts
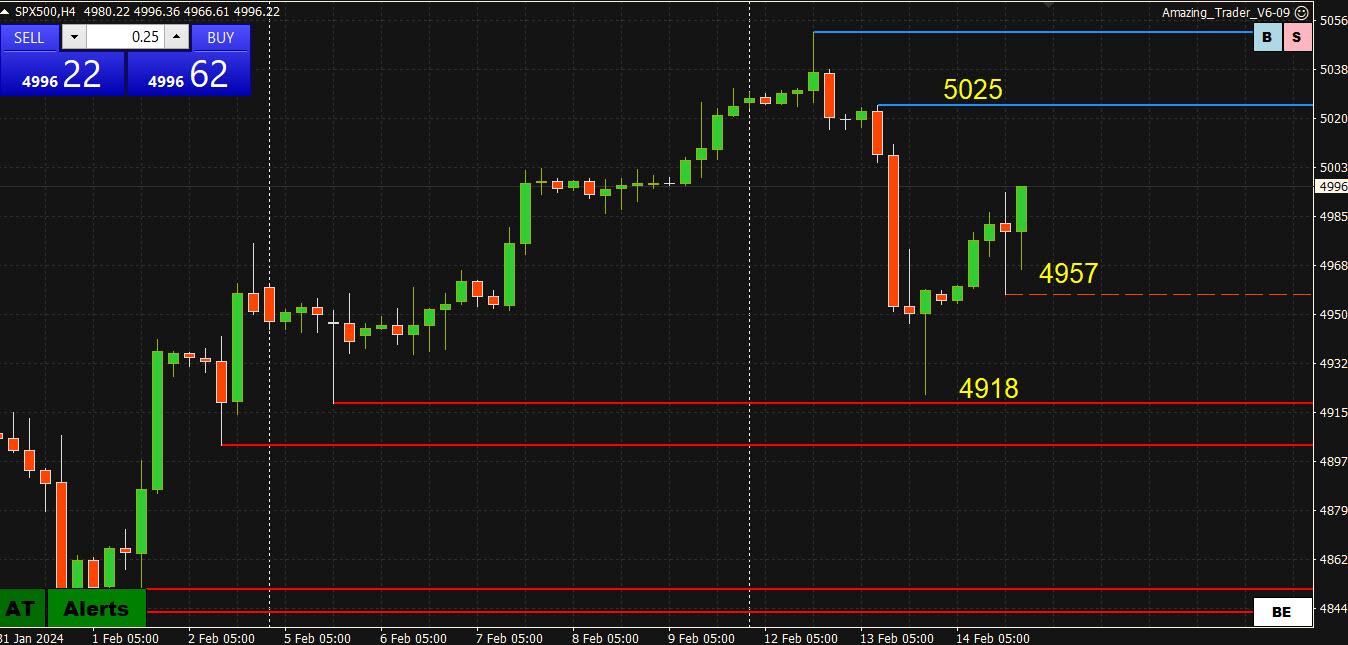 SPX500 4-hour chart
- You must be logged in to reply to this topic.
© 2024 Global View